[Trade Journal]
Publication: Elektrotechnische Zeitschrift
Berlin, Germany
vol. 31, no. 34, p. 853-857, col. 1-3
Testing of high-voltage overhead line insulators with regard to discharge phenomena.(1)
By Dr. Ing. W. Weicker, Hermsdorf S.-A.
The behavior of high-voltage insulators under voltage has been discussed quite frequently recently, and the question of the safety factor of insulators has been touched upon repeatedly. This is generally understood to be the ratio of the flashover voltage to the operating voltage. For insulators for dry interior spaces, this definition may produce reasonably clear values, but for overhead line insulators, this is not the case at all. Here, a clear determination of the flashover voltage value encounters considerable difficulties. The extraordinary deviations in the voltage values determined on the same insulator, but at different times and under different conditions, prove this sufficiently. The reason for this lies in the extraordinary "sensitivity" of a high-voltage insulator to different test conditions and in the fact that the circumstances that are decisive for its assessment are usually not taken into account sufficiently. In addition, experience has shown that the observations and measurements made in the laboratory usually correspond only slightly to reality, i.e. to the operating and weather conditions prevailing on the line. Finally, it remains to be seen whether the determination of the flashover voltage alone allows a decisive assessment of the insulator in electrical terms. The following discussions should help to clarify all of these questions:
With reference to what has just been said, it was first of all absolutely necessary to carry out tests outdoors, which had to extend over as long a period as possible in order to take account of all possible weather conditions. The Hermsdorf S.-A. porcelain factory, which, as is well known, has always been at the forefront of dealing with porcelain-technical issues, spared no means of making it possible to carry out these, in some cases, very lengthy tests. A test facility equipped with all the necessary tools was set up on the roof of its test area specifically for this purpose. In this facility I carried out continuous tests over a period of almost 7 years, mostly at the same time as corresponding tests in the indoor test rooms under artificial rain.
The above-mentioned aim was attempted to be achieved in two ways:
1. By observing a single or a few individual, always identical insulators under a wide variety of test conditions in relation to discharge phenomena and determining the respective characteristic voltage, in particular the flashover voltage, and
2. By measuring the power loss at a constant voltage on a large number of insulators connected in parallel using wattmetry.
3. A third, less important method is the measurement of the surface resistance.
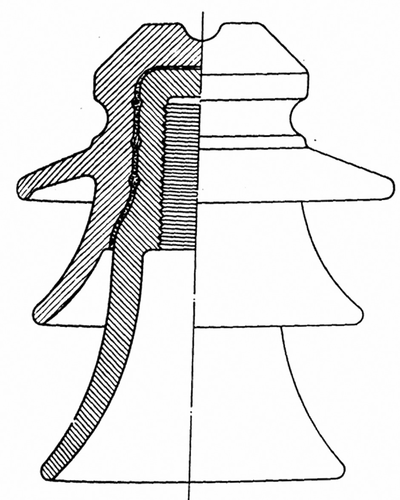 |
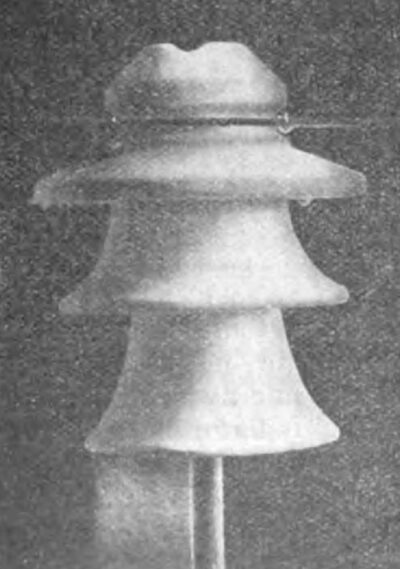
| Fig. 1. Delta Bell for 40,000 Volt Operating Voltage. |
The tests covered a wide variety of insulator sizes and a wide variety of voltages. At this point, to characterize the general conditions, reference is made to just one individual insulator, namely a delta bell for a normal 40,000 V operating voltage for the discharge phenomena (Fig. 1). and for loss measurements to a smaller one for 10,000 V.
| |||
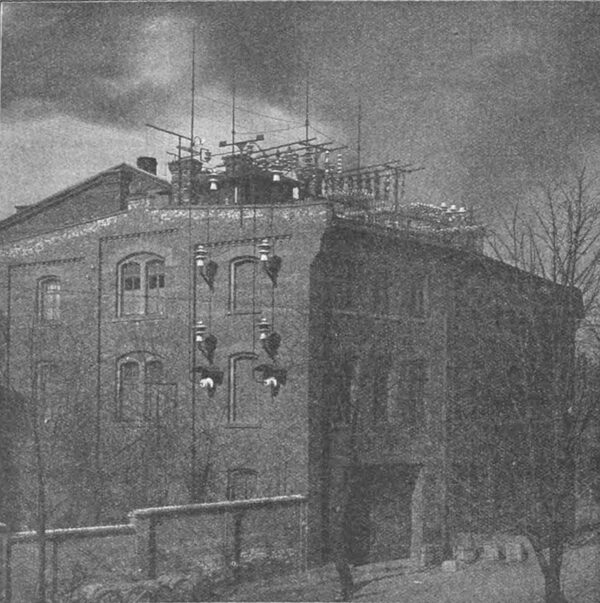
| Fig. 2. Test Track of the Porzellanfabrik Hermsdorf S.-A. for 200,000 Volts and Outdoor Test Facility. |
| |||
| Fig. 3. Outdoor Experimental Facility for Continuous Observations and Measurements. |
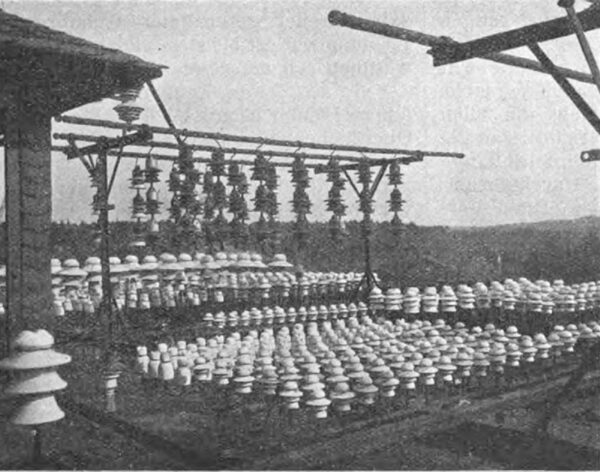
Finally, comparative tests with hanging insulators for 80,000 V operating voltage should be mentioned. Figures 2 and 3 show part of the test arrangement with the insulators set up outdoors.
The various circumstances that determine the behavior of an insulator under voltage will now be briefly discussed below. These can be divided into those of a purely electrical nature, which are therefore particularly determined by the level of voltage, and those that are determined by the test arrangement, the weather and other external conditions.
I. Measuring the voltage.
The maximum voltage, not the effective voltage, is decisive for the flashover voltage and all other discharge phenomena of an insulator. However, since all common voltmeters, even most electrostatic high-voltage voltmeters, only measure effective values, knowledge of the crest factor of the voltage curve is still necessary. How important this determination is and how easily, particularly in laboratory experiments with mostly limited transformer and generator power, often overlooked distortions of the voltage curve can occur can be shown by an example:
A 10 KW generator from the Hermsdorf porcelain factory had an exact sine curve when idling. By connecting an idling transformer, which only needed 2 KW even at full voltage, the crest factor changed to 1.48 to 1.59 depending on the level of the terminal voltage. Connecting a different number of insulators influenced the size of the crest factor by a further 15%, depending on their number and the level of the voltage, while connecting an overhead line only 20 m long, albeit with a relatively large capacity(2), reduced its value to 1.35 to 1.40. The connection of a pole again resulted in other changes in the shape of the curve.
In addition to this, there is the well-known large influence of any resistor connected upstream in the primary circuit. In any case, even these few details make it clear that it is absolutely necessary to be precisely informed about the size of the crest factor for the entire voltage range under consideration during the test and for all the test conditions chosen.
Otherwise, a comparison of the spark voltage values is impossible from the outset. The crest factor can now be determined and the maximum voltage calculated:
a) By recording and evaluating the voltage curve, e.g. B. using an oscilloscope, or
b) using a measuring spark gap, with which maximum voltages can be measured directly.
The numerous aspects to be taken into account in the first method of determination will not be discussed here, but only a few words will be said about the second method, and this is because this method, as simple as it is in itself, has so far hardly been used for precise absolute voltage measurements due to the uncertainty of the available determinations. Even the best-known literature data on the level of the spark voltage associated with a certain peak discharge distance, for example, differ by 30% or more. If this method was to be made usable for precise voltage measurements, it was therefore first necessary to create certain bases for an assessment of the measured values. I have tried to do this on the basis of Toepler's work, which, as theoretical-physical work, has unfortunately received little attention in electrotechnical circles. From the results of my experiments published elsewhere, it should be mentioned here that the strict separation of (spark) discharges into individual, fundamentally different forms of discharge, established by Toepler on the basis of his measurements with mostly high-voltage direct current, can also be transferred to technical alternating current, and is even simplified here. With alternating current, it is sufficient to distinguish the following two discharge processes: either the spark voltage is identical to the initial voltage, i.e. the spark breaks out of the electrode without any preceding luminous phenomenon, or the spark voltage corresponds to the limit voltage of the brush discharge, i.e. the spark is preceded by a brush that fills almost the entire electrode space in addition to the glow on the surface, and the spark runs along the path prepared by the sliding brush that shoots out last.
For both discharge forms, the initial voltage and the brush limit voltage, different laws apply in every respect. By choosing the appropriate electrode shapes, it is possible to obtain one or the other discharge form.
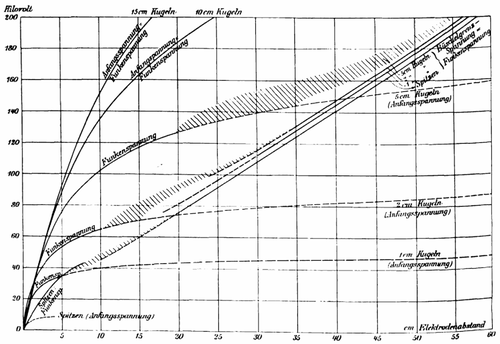 |
| Fig. 4. Voltage Curves for Point and Ball Electrodes of Different Diameters. |
To show how, for example, within 0 to 200 KVeff. and 0 to 60 cm electrode spacing, the curves of the spark voltage change depending on the electrode shape, Fig. 4 shows the curves for ball electrodes of 1, 2, 5, 10 and 15 cm diameter, as well as for point electrodes, based on uniform conditions (pure sine curve, 740 mm. mercury barometer reading, 20 degrees temperature and 50% relative humidity). Insofar as the curves represent spark voltage values, they are highlighted as solid curves. From this compilation, one can see that, for example, For example, up to 200 KV voltage, a completely constant spark voltage curve (namely as initial voltage) can only be obtained on spherical electrodes of 10 and 15 cm. For smaller spherical electrodes, on the other hand, the spark voltage corresponds partly to the initial voltage and partly to the brush limit voltage (see the curves for 1 and 2 cm diameter balls). Between the two discharge forms there is a transition area (not particularly highlighted in Fig. 4, however, due to the limited space for 1 cm balls), within which sparks break out at very irregular voltages. Sharply defined brush formation and spark breakout from a sliding brush occurs sooner the smaller the electrodes are; even for point electrodes, however, only above about 70 KVeff., so that clear spark voltage values (as brush limit voltage) can only be expected from this voltage onwards. The lower voltage values for point electrodes belong to another discharge form, namely the glow limit voltage, and only the very smallest initial voltage spark voltage values belong to the initial voltage. However, these voltage values (as glow limit or initial voltage) are quite uncertain and suitable for measuring purposes due to the often irregular and abrupt transition of the individual discharge forms and due to the strong dependence on the tip shape. Only in the area of the brush limit voltage does the spark voltage between two point electrodes or small ball electrodes run linearly. Then point electrodes with a not too small opening angle (i.e. definitely not sewing needle tips!) are definitely preferable to other electrode shapes for voltage measurements.
Of course, as with all determinations using a measuring spark gap, in order to enable a reduction to uniform values, a whole series of aspects must be taken into account; e.g. B. Humidity, temperature, air pressure, influence of the electric field by neighboring leads, shape of the tips, etc.
With regard to the later findings on insulators, it should be emphasized that the humidity in particular has an extraordinary influence on the flashover voltage (but only as a bunch voltage), in the sense that increased humidity makes the flashover more difficult, thus increasing the flashover voltage, not reducing it.
However, if all of these sources of error are sufficiently taken into account and reduced to uniform conditions, voltage values accurate to within a few percent can easily be obtained, which is usually sufficient for practical measuring purposes. In fact, under the conditions mentioned, the use of a measuring spark gap, which also offers good control over any voltage increases due to resonance phenomena or voltage losses in the transformer or in the high-voltage lines, cannot be recommended strongly enough.
II. Arrangement of the insulators during the test.
The way in which the insulator is mounted is not without significance, for example, an increase in the support diameter and an increase in the conductor wire diameter always reduce the voltage. There can be considerable differences, for example, voltage differences of up to 15% were measured between 10 and 30 mm support diameters on the same insulator and with the same striking distance; the same applies to a change in the conductor wire diameter.
With regard to the way in which the conductor wire is laid, I have already pointed out elsewhere that a more even field distribution has a considerable influence on the level of the spark voltage. As a result, it is not unimportant, for example, whether the conductor wire is only fastened by a collar or even mounted on a cap that covers the entire head of the insulator. In the latter cases, even with the same striking distance, the voltage can be increased significantly (up to 15% and more). In general, it can be said that a change in the electric field, whether due to the arrangement of adjacent insulators, grounding of a pole, or any other circumstances, cannot be given enough importance and that many apparent irregularities can be traced back to this. In addition, the apparently sudden voltage jump that is often observed even on the same insulator and with the same arrangement is often only due to the transition from one form of discharge to another, in particular from the initial or glow limit voltage to the brush limit voltage. Another form of discharge is the occurrence of sliding discharge, particularly in large post insulators or those with a relatively high elementary capacitance¹). This variety of discharge forms and the variety of laws that apply to them in itself makes it difficult to assess the spark voltage on insulators.
Everything that has been said so far applies first of all to the determination of the flashover voltage on a dry insulator. When testing an insulator in rain, a whole series of other factors come into play with regard to the arrangement of the insulator, for example, the extent to which the lower insulator jackets are wetted by splash water depends in particular on the height of the support and the way it is attached to the crossbeam. For this reason too, the insulator should be mounted as closely as possible to the actual conditions during the test.
With regard to the influence of atmospheric conditions, i.e. temperature, air pressure and air humidity, it should only be noted here that the first two influences are generally rather less important than other influences, at least in rain tests. Only air humidity requires a few words of mention. It has already been pointed out above that in the area of the brush limit voltage, an increase in air humidity does not make sparking easier, but on the contrary makes it more difficult. This also applies to insulators, especially to larger ones, as soon as the spark is preceded by a clearly pronounced brush discharge; the increase in voltage with increasing air humidity is then quite significant. Only when condensed water vapor deposits on the insulator jackets does a rapid drop in the sparking voltage become noticeable for all insulator sizes, as the wetting of the surface promotes the occurrence of sliding sparks.
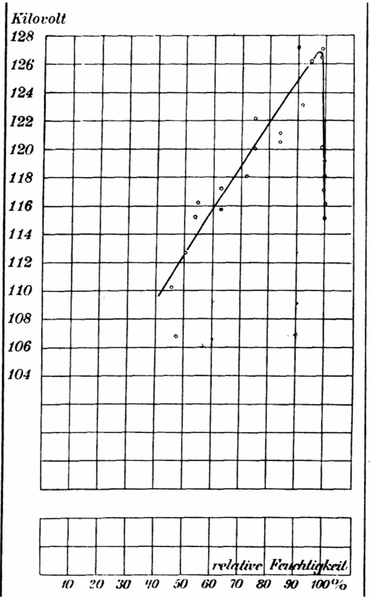 |
| Fig. 5 Dependence of the Spark Voltage of A Larger Insulator on the Relative Humidity. |
To illustrate what has been said, Fig. 5 shows the spark voltage of the above-mentioned insulator for 40,000 V operating voltage (Fig. 1) as a function of the relative air humidity. This behavior of the insulator is of the utmost importance, especially in rain tests. Before doing so, however, we shall briefly describe the different nature of discharge phenomena during rain.
III. Discharge phenomena in rain.
Even if such a sharp separation of the discharge forms as with geometrically simple electrode shapes (Fig. 4) is not possible with insulators, a distinction between the individual discharge phenomena is nevertheless essential.
In addition to the well-known spark discharge (also called "pop sparks" because of the characteristic accompanying phenomenon), the discharge phenomena that occur in the rain at a much lower voltage must also be taken into account, which can be briefly summarized below under the collective name "pre-discharges". However, I would like to first give a few characteristic examples using a few illustrations to show how different these pre-discharges can be. I do this firstly to draw attention in general to the great influence of different test conditions in a rain test, and secondly to be able to make certain conclusions in advance for the following discussions.
| |||
| Fig. 6. Cracking Sparks in Light Rain. |
| |||
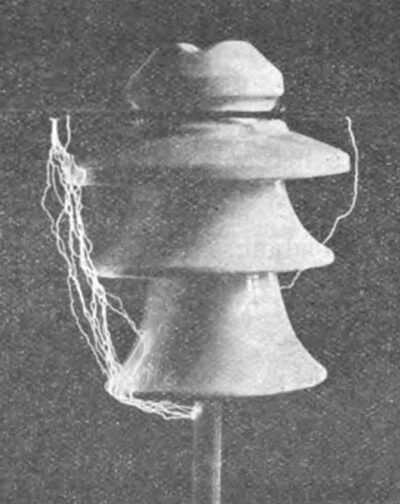
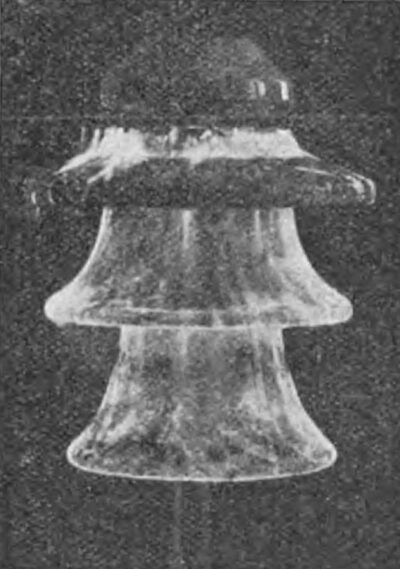
| Fig. 7. Pre-Discharges Originating From the Upper Mantle in Vertical Rain |
| |||
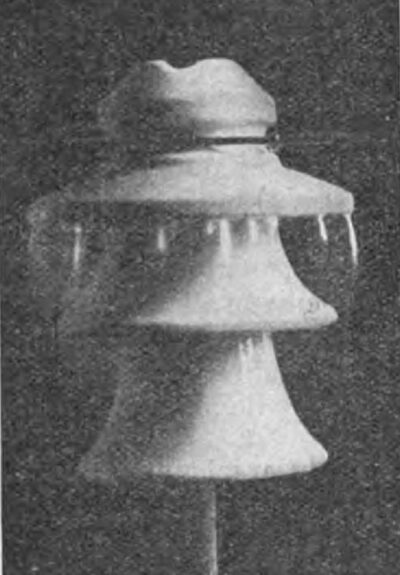
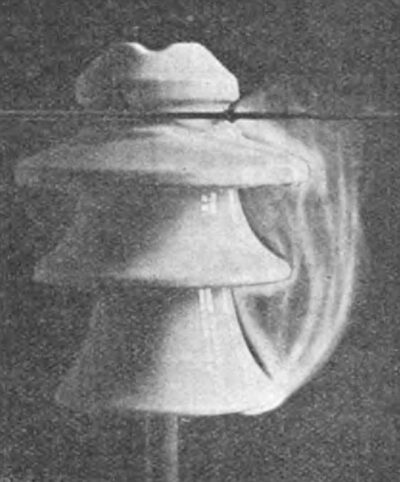
| Fig. 8. Pre-Discharges Starting From the Middle Mantle. |
| |||
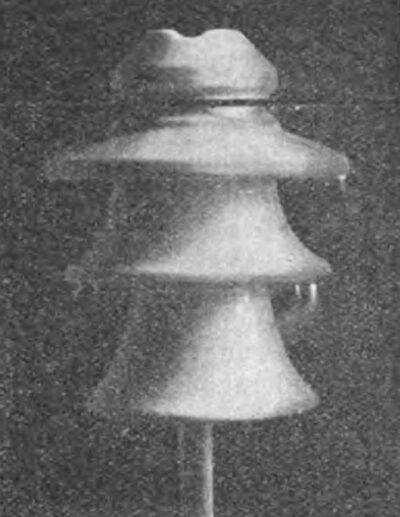
| Fig. 9. Pre-Discharges Between Insulator Sleeve and Support During Very Slanted Irrigation. |
| |||
| Fig. 10. Glow of the Insulator in A Water Vapor Saturated Atmosphere. |
| |||
| Fig. 11. Arc With Low Series Resistance in the Transformer Circuit and Heavy Wetting. |
| |||
| Fig. 12. Sliding Sparks With High Series Resistance in the Transformer Circuit and Heavy Wetting. |

Fig. 6 shows the above-mentioned explosive sparks, which, as should be mentioned, only flash over in this form between two metal electrodes, i.e. in the case of insulators between the support on the one hand and the conductor wire on the other. Pre-discharges of any other form, however, are also possible at other points on the insulator, as the following figures show. The spark discharge just mentioned occurs when the voltage is quickly increased to the flashover value. If the insulator is rained on, brush discharges are visible before the flashover, which originate from the water drops falling on the edge of the upper casing (Fig. 7). If the cavities between the individual jackets are heavily wetted by prolonged irrigation or other circumstances, the first discharge phenomena always occur where the driest parts of the insulator are, because this is where the greatest voltage gradient exists. For example, in Fig. 8, brush discharges occur between the middle jacket and the sleeve; in Fig. 9, however, where these areas were also completely wetted by completely horizontal irrigation, the first discharge phenomena took place in the form of reddish sparks between the sleeve edge and the support, because the cavity in between had remained relatively dry. All of these discharges do not show the shiny white color, but only a reddish-violet glow, because they only carry a very small current due to the high upstream resistance of the moist porcelain surfaces. The discharge phenomena are still different when the entire surface of the insulator is evenly wetted, e.g. B. is wetted by condensed water vapor. In this case, a direct current transfer takes place over all surfaces, which results in the entire surface lighting up evenly (Fig. 10). As the water dries and the voltage distribution on or between the individual insulator jackets changes, the luminous phenomena also change, and as the voltage increases, discharges also occur between the individual insulator parts, such as the one running directly through the air. If the transformer has sufficient power and the series resistance is low, the formation of a standing arc (Fig. 11) is the further consequence. If, on the other hand, these conditions are not met, only sliding spark discharges(3) occur, which are closely connected to the wetted surfaces (Fig. 12).
This compilation, which deals only with the most important forms of discharge(4) and only one single insulator size, allows us to conclude how different the discharge phenomena can be and what an extraordinary influence the individual test conditions will have. This will be discussed in more detail below, comparing the experiments in the laboratory with those carried out outdoors under natural conditions.
IV. Influence of test conditions on artificial rain.
1. Rain intensity.
As is easy to explain, increasing rain intensity reduces the voltage for the occurrence of discharge phenomena on the insulator. Fig. 13 illustrates how this influence is exerted for the insulator shown in Fig. 1. According to this, even with the slightest rain on the insulator, both the measured voltage values for the spark voltage and the measured voltage values for pre-discharges fall significantly compared to the corresponding values for a dry insulator. For further increases in rain, however, the decrease in the spark voltage is only slight.
Similar curves to those for this insulator are obtained for all insulator sizes and have also been observed by other observers. For artificial rain tests, a rain intensity of around 4 mm of precipitation per minute would be sufficient. If we compare this with the precipitation observed in nature, according to the literature 10 mm per minute is the heaviest rainfall ever measured. Precipitation of 2 mm sometimes occurs in our region during particularly heavy downpours, but precipitation of more than 4 mm, i.e. heavy cloudbursts, is extremely rare. The most common rainfall in our region, corresponding to so-called rain, is only about 0.1 to 0.2 mm per minute. For this, for example, a spark voltage of about 100 KV was measured on the above insulator outdoors, a value that almost corresponds to the corresponding value for artificial rain.
So even according to these meteorological data, 4 mm is to be regarded as the extreme practical limit.
It should also be noted that the measurement of the intensity of artificial rain should always be carried out while the test arrangement is under voltage, since this may influence the scattering of the rain and otherwise the rain intensity would be determined to be slightly too high.
2. Direction of the rain.
Insulator, as in Fig. 13, for a rain of about 2 mm/min, the angle of incidence of the rain against the vertical is given as the abscissa. In particular, the pre-discharges occur for horizontal rain at just a little more than half the voltage measured for vertical rain, and even at an angle of inclination of 45° the voltage for the occurrence of discharges is significantly reduced.
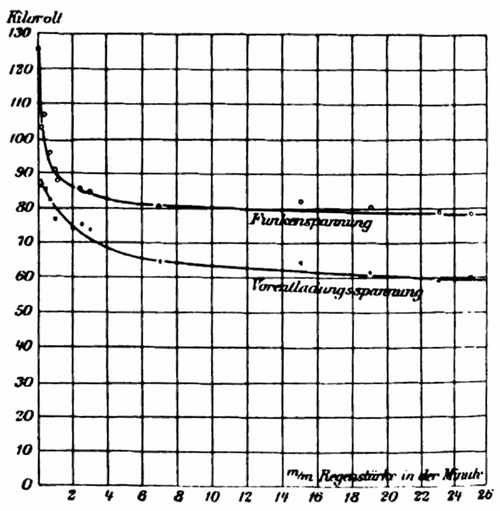 |
| Fig. 13. Dependence of the Pre-Discharge and Spark Voltage on the Intensity of the Rain. |
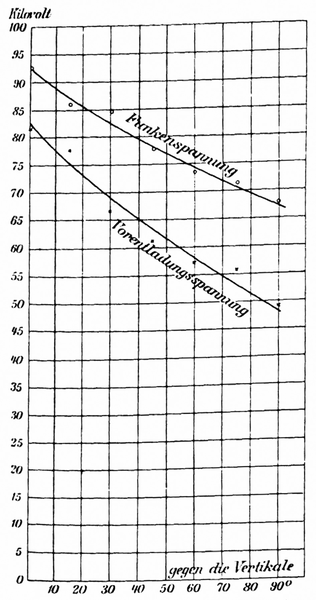 |
| Fig. 14. Dependence of the Pre-Discharge and Spark Voltage on the Direction of the Rain. |
If one compares this with the direction of the rain during violent thunderstorms in nature, it must be admitted that 45° is by no means an unusual angle of incidence.
It should also be mentioned that the change in the angle of incidence of the rain when testing insulators should not be achieved by vertical rain, which is already extremely rare. The most common rainfall in our area, corresponding to so-called rain, is only about 0.1 to 0.2 mm per minute. For this, for example, a spark voltage of about 100 KV was measured on the above insulator outdoors, a value that is almost identical to the corresponding value for artificial rain. Simply rotate the support around a horizontal axis. This would give a completely false picture in terms of discharge phenomena. Rather, the water must be sprayed at the appropriate angle onto the vertical insulator.
3. Pressure of rain.
In most artificial wetting devices, the water hits the insulator under much too high a pressure. The result is unnatural splashing of the water. This explains why very different voltage values are obtained at different distances between the shower and the insulator, and the lower the voltage values are the closer the shower is to the insulator. For artificial rain tests, the shower should therefore be at least 1 to 2 m away from the insulator.
Summary.
A number of examples are used to show which aspects need to be taken into account when testing and assessing a high-voltage insulator in relation to discharge phenomena. The main factors to be considered are: the magnitude of the crest factor of the voltage curve, for which brief instructions are given on how to determine it experimentally using a measuring spark gap; the influence of the electric field in the vicinity of the insulator (earthing if necessary); the diameter and type of fastening of the conductor wire and support; the height of the support; air pressure; temperature; air humidity; the intensity and direction of the rain; the arrangement of the shower; the duration of the test; the sequence of tests; the surface quality of the insulator; the type of voltage regulation, and above all the subjective assessment of the extremely diverse forms of discharge phenomena.
(1) Lecture given at the 18th Annual Meeting of the Association of German Electrical Engineers in Braunschweig in 1910. For discussion, see ETZ 1910, p. 744
(2) In addition, it should be noted that the change in capacitance as such, as well as the change in the number of periods, has no influence on the level of the maximum spark voltage within the limits applicable for technical measurements, but can only indirectly influence the value of the effective voltage through possible distortion of the curve shape.
(3) The distinction often required in test reports between the voltage at which a spark discharge occurs and that at which arcing occurs is therefore completely irrelevant, because this does not depend on the behavior of the insulator, but only on the respective electrical conditions.
(4) In addition to these discharge phenomena, which are more or less related to the surface quality of the insulator, there are also the sliding brush discharges that occur at high capacitance, which, when the insulator is dry, spread from the conductor wire over the entire head; the glow that is visible at high voltage between the individual insulator sheaths as a result of too great a field density should also be mentioned here.
