[Trade Journal]
Publication: American Institute Of Electrical Engineers
New York, NY, United States
p. 2121-2142, col. 1
HIGH-FREQUENCY TESTS OF LINE INSULATORS
BY L. E. IMLAY AND PERCY H. THOMAS
The object of this paper is to present for consideration certain very interesting and suggestive high-frequency insulator tests recently made by the authors. These tests were undertaken to determine the availability of a certain insulator for use on a projected 38,000-volt line and resulted in a radical modification of the design. Having a strictly utilitarian purpose in view, these tests were not expanded to the point that would be desirable from a scientific point of view, although the nature of the results shows the great desirability of further research in this same field. With this explanation the plan of the tests will be understood.
A certain transmission system [Canadian Niagara Power Co.] has used three parallel circuits operating at 22,000 volts to transmit a rather large amount of power some 16 miles for a number of years. The demand for more power has rendered a new line necessary, which is being installed for 38,000-volt operation. The insulators on the old lines are made of electrose having an umbrella petticoat about 12 in. (30.4 cm.) in diameter, and a second smaller petticoat about 6 in. (15.2 cm.) in diameter. They were originally intended to be used on 38,000 volts when the' rise of the load should require. Experience showed that these insulators occasionally punctured through the head from lightning, such failures being very difficult to find. The insulators are mounted on grounded steel pins. This sort of failure was very surprising in view of the fact that these insulators had never been punctured in testing, though they would arc over when wet at about 90,000 volts, as indicated on the primary side of a 25-cycle testing transformer.
It was this discrepancy between the repeated punctures through the head from the conductor to the pin due to lightning, and the steady refusal of the insulators to puncture on a 25-cycle testing set, that led to the high-frequency, high-voltage tests described below.
These tests were made to determine directly whether any difference in the behavior of the insulators could be determined between the use of high frequency and 60 cycles, both produced in the laboratory.
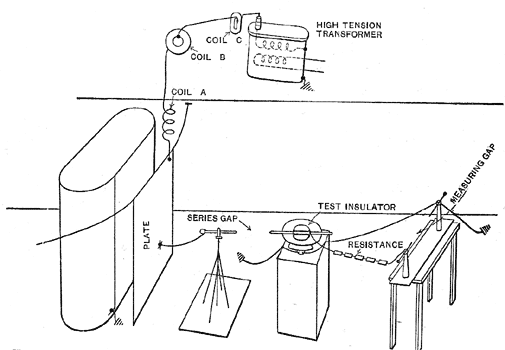
The circuits for the high-frequency tests are shown in Fig. 11.
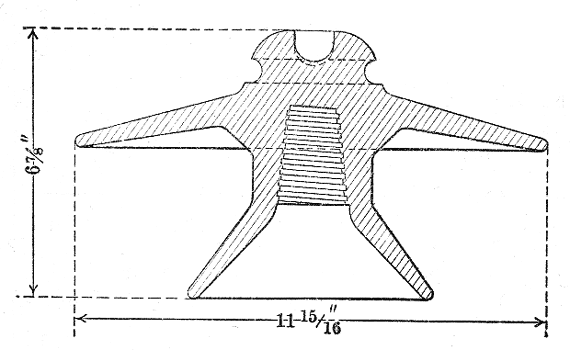 |
| Fig. 1 - Original Insulator |
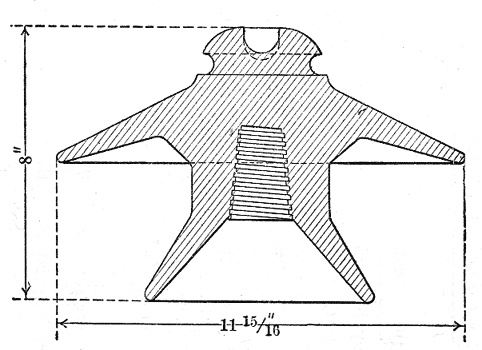 |
| Fig. 2 - Proposed 38,000-Volt Insulator |
In this figure is indicated a 500-kw., 750,000-volt transformer. One side of this transformer is grounded and the other side connected to the discharge apparatus. The "plate " shown was a sheet iron plate approximately eight by nine ft. (2.4 by 2.7 m.), estimated capacity 0.0001 microfarad, suspended by a cord approximately 3.5 ft. (1.06 m.) from a large transformer tank, which served as a ground plate. The coils marked A, B and C were three air-core choke coils intended to protect the transformer. The coil A was a helix having a diameter of 18 in. (45.6 cm.), and had approximately 22 turns of wire, the turns being spaced approximately three in. (7.6 cm.) apart. The coil B was circular and approximately 24 in. (60.9 cm.) in diameter and had 10 turns. The coil C was a pancake coil and had approximately 200 turns with a mean length of turn of 37.7 in. (95.8 cm.) This coil C was shunted by a graphite resistance of about 125,000 ohms.
The insulator to be tested was mounted on a wooden box some four ft. (1.22 m.) from the floor and had a half-inch (12.7-mm.) brass rod tied in the groove by a band of small size copper wires. The pin carrying this insulator was grounded through a wire approximately six ft. (1.8 m.) long. The length of the lead from the transformer terminal to the condenser plate was approximately 50 ft. (15.2 m.)
A series discharge gap was made by approaching a second brass rod mounted on a wooden stand to one end of the (1.27-cm.) rod tied to the insulator, the second rod being connected to the sheet iron condenser plate by a wire two or three ft. (60 or 90 cm.) long.
Where a measuring gap was used, as recorded in the reports below, this consisted of a needle point gap mounted on hard rubber pedestals located some six ft. (1.8 m.) from the insulator under test. One side of this gap was connected, either with or without resistance, to the conductor on the insulator under test, and the other side was connected to the insulator pin or to the ground.
The general method of test was to raise the voltage of the generator feeding the primary until a discharge occurred across the series gap onto the insulator. With the adjustment of generator voltage and transformer ratio used, the result of the breakdown of the gap was in most cases to so reduce the applied voltage that the arc proper would drop out, at least partially, leaving the series gap nearly intact, and thus the return of voltage on the next alternation would be obliged to nearly reproduce the original breakdown voltage on the gap. The effect of this arrangement was to give a continuous succession of static sparks lasting as long as voltage remained on, that is, one or two seconds, as distinguished from the holding of a continuous arc over the gap. In the tests of June 24th, however, the opposite effect was secured, that is, a single static spark each time the voltage was raised, followed by a mild arc.
The terms "application of voltage" and "trial" used hereinafter mean the raising of voltage to the breakdown point and the cutting off of voltage one or two seconds later.
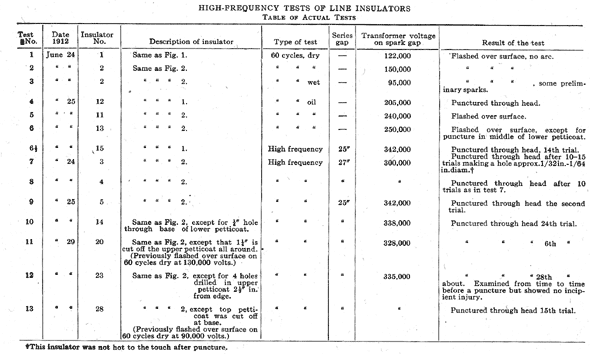
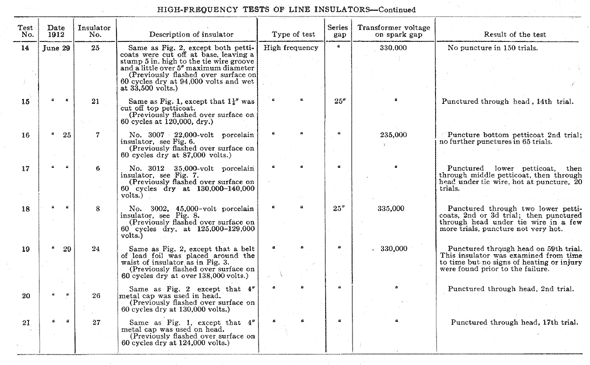
The results of the various tests have been tabulated as follows, and the tests will be considered briefly in groups.
 |
 |
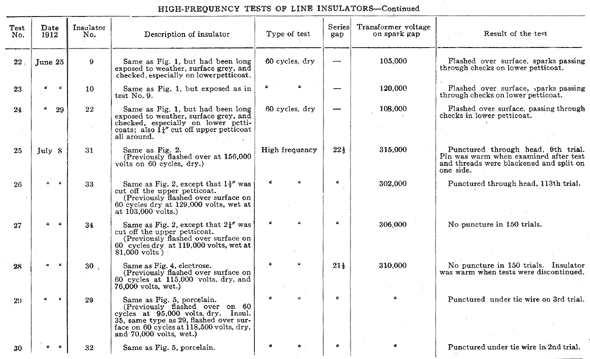 |
First Group. (Tests 1-2) Normal Flash-Over Test, Dry, in Air, 60 Cycles.
This group of tests was preliminary and was made in the usual manner, the voltage being measured by a spark gap checked approximately by a voltmeter reading on the low-tension winding of the raising transformer. In no case did an insulator puncture. An insulator of the type shown in Fig. 1, that now in use in the three existing lines, flashed over at 122,000 on the second trial; the insulator of the type shown in Fig. 2 flashed over at 150,000 volts. The insulator of Fig. 2 is a new design that was intended to replace the insulator of Fig. 1 and to resist lightning stresses better. The two insulators are the same except that the later design has a head nearly two in. (5 cm.) thick in comparison with a head thickness of one in. (2.5 cm.) in the old insulator of Fig. 1.
Second Group. (Test 3) Normal Flash-Over Test, Wet, in Air, 60 Cycles.
These tests were made with the same electrical apparatus as the first group. Water was thrown on the insulator from three spray nozzles at one side, giving a very heavy "scotch mist." The water dripped very rapidly from the petticoats during the tests, but no direct measurement was made of the amount of water sprayed. The water was relatively pure river water.
The insulator of Fig. 2 flashed over at approximately 95,000 volts.
Third Group. (Tests 4-6) Normal Test Under Oil, 60 Cycles.
The insulators were immersed in good "transil" oil, bubbles under the petticoats and in the pinhole being carefully eliminated. The insulator of Fig. 1 punctured through the head at 205,000 volts, and that of Fig. 2 flashed over the surface, once at 240,000 volts and once at 250,000, except that the lower petticoat was punctured at a point .intermediate between the edge and the central portion in the latter test.
Fourth Group. (Tests 6 1/2-9) High-Frequency Test: apparatus as shown in Fig. 11.
The insulator of Fig. 2, that is, the new insulator with the 2-in. (5-cm.) thickness of head, punctured from the conductor to the pin. The first two insulators tested failed on the tenth to fifteenth applications of voltage, and the third insulator on the second trial.
This result was most surprising, since insulators of this type had flashed over the surface even under oil rather than puncture through the head at 60 cycles. The unusual character of this behavior made a furthur investigation imperative, and the following tests were made.
Fifth Group. (Tests 10-15) High-Frequency Tests as in Fig. 11. (continued.)
Insulators of the type of Fig. 2 were altered in various ways and subjected to the same test. As electrose can be sawed and drilled such alterations could be easily made. The results were as follows:
a. With 1/4-in. (6.3 mm.) hole drilled at the base of the lower petticoat, the insulator failed by puncture through the head on the twenty-fourth trial.
b. With 1 1/4-in. (31.7-mm.) turned off the edge of the upper petticoat, the head failed as before on the sixth trial. This insulator had previously flashed over, as altered, at 60 cycles on 130,000 volts, dry.
c. With four equally spaced 1/4-in (6.3-mm.) holes drilled through the upper petticoat 21 in. (5.7 cm.) from the edge, this insulator punctured in the head on the twenty-eighth trial.
d. With the top petticoat entirely cut off, an insulator punctured in the head on the eighteenth trial. This insulator, as altered, had previously arced over on 60 cycles at 90,000 volts, dry.
e. An insulator with both petticoats sawed off as closely as practicable, leaving a stump about 5 in. (12.7 cm.) high to the tie wire groove and a little over 5 in. (12.7 cm.) maximum diameter, showed no failure in over 150 trials. Apparently this insulator was capable of standing this application of high frequency at 340,000 volts indefinitely.
f. A similar test was made on an insulator as shown in Fig. 1 with 1 1/4 in. (3.1 cm.) turned off the upper petticoat. This punctured the head as usual on the fourteenth trial. Previously this insulator had flashed over the surface on 60 cycles at 130,000 volts.
These results, which were all on electrose insulators, showed most plainly that the resistance to high-frequency stress, in this sort of apparatus at least, bore little relation to its strength against the normal 60-cycle stress. The question naturally arose, were these results peculiar to electrose? Some porcelain insulators were then obtained and high-frequency tests made upon them, as follows:
Sixth Group. (Tests 16-18) High-Frequency Tests, as Shown in Fig. 11.
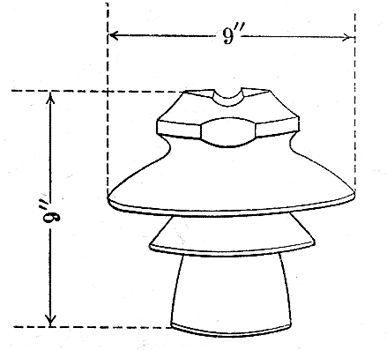
A porcelain insulator, No. 3007, recommended for 22,000 volts, showed a puncture in the lower petticoat on the second trial, but suffered no further damage in 65 trials. This insulator had previously flashed over at 87,000 volts, dry, 60 cycles.
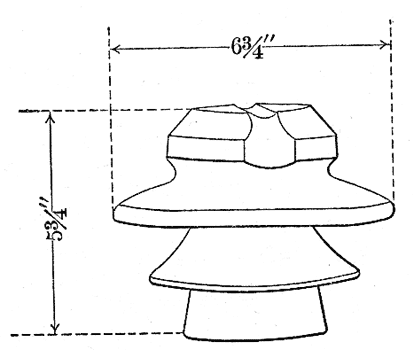
A porcelain insulator, No. 3012, recommended for 35,000 volts, showed a puncture first on the lower petticoat, then in the middle petticoat and then through the top under the tie wire. This insulator had previously flashed over on 127,000-135,000 volts, dry, 60 cycles.
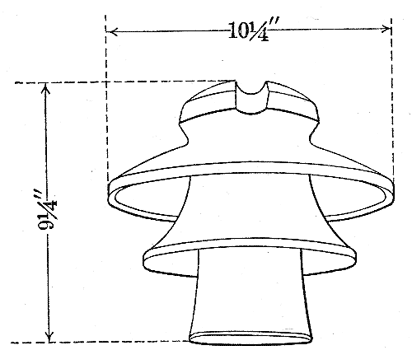
A porcelain insulator, No. 3002, recommended for 45,000 volts, showed a puncture in the two lower petticoats on the first or second trial and a puncture under the tie wire in a few more trials. This insulator had previously flashed over at 125,000-129,000 volts on 60 cycles,
From these tests on porcelain insulators it appeared that this feature of failure on high frequency was not peculiar to electrose.
It was surmised that the peculiar effect of high frequency was due to a different distribution of electric stresses produced under this condition, which distribution may be assumed to cause a concentration of potential at certain points. Some tests were therefore devised to verify this assumption.
Seventh Group. (Tests 19-21) High-Frequency Tests, as Shown in Fig. 11.
a. A new insulator of the type of Fig. 2 was covered with lead foil about the waist as shown in Fig. 3. This foil was entirely disconnected from any metal parts; but, in view of its electrostatic capacity to the pin, it would change the distribution of potential during the high-frequency attack. Its effect would obviously be toward increasing the effective size of the pin top. This insulator punctured through the head on the 59th trial. It had previously flashed over the surface at 138,000 volts on 60 cycles. While this insulator was not proof against the high frequency, it stood up longer than any of the other electrose insulators, even longer than those with reduced petticoats, except the one without any petticoat. This result is very illuminating, as this insulator had all its petticoats intact.
b. A test was made with a new Fig. 2 insulator with a metal cap, about 4 in. (10 cm.) across, on the top of the insulator. The electrical effect of this should be opposite to that of the lead foil of a above. This insulator showed a puncture in the head on the second trial. This insulator with cap had previously flashed over at 130,000 volts on 60 cycles, dry.
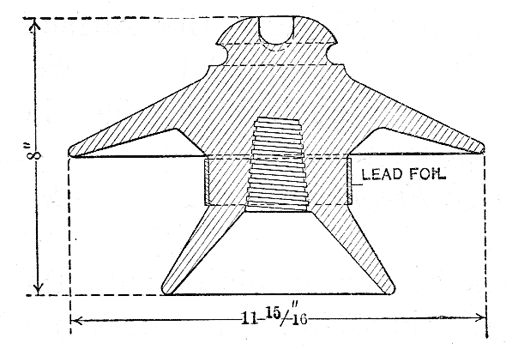 |
| Fig. 3 - Electrose Insulator of Fig. 2, With Band of Lead Foil About Waist |
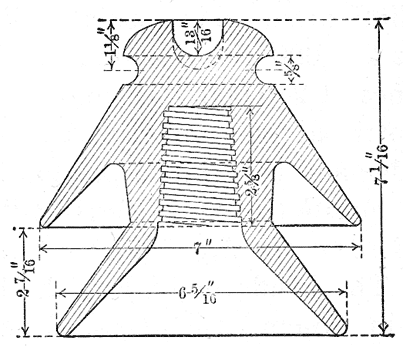 |
| Fig. 4 - Type E Insulator - Electrose - 22,000 Volts |
c. The same test as "b" was made on a Fig. 1 new insulator and the insulator showed a puncture in the top on the seventeenth trial. This insulator with cap had previously flashed over at 124,000 volts on 60 cycles, dry.
These last three results, while few, indicate pretty clearly the cause of the weakness as well as the nature of experiments required to clarify this matter further.
Those electrose insulators of the type of Fig. 1 which had been in service for some years showed a roughening and a bleaching of the surface to a light gray from the effects of exposure to the weather. Some of these old insulators further showed checks on the surface extending to various depths, mostly on the lower petticoat. Tests were made to get the effect of the weathering on the behavior of the insulator.
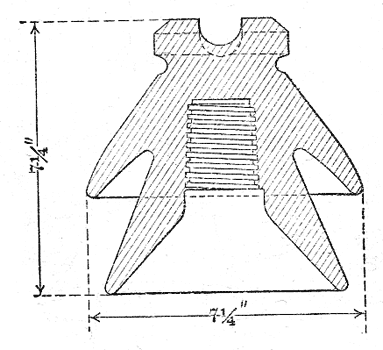 |
| Fig. 5 - Type E Insulator - Porcelain - 22,000 Volts |
 |
| Fig. 6 - Porcelain Insulator No. 3012 |
Eighth Group. (Tests 22-24) Weathering Tests, 60 Cycles, Dry.
a. Two old insulators showed a dry flash-over on 60 cycles on 105,000 and on 120,000 volts, respectively, a loss of insulating power of perhaps 10,000 volts. which was undoubtedly due to the arc passing through checks in the lower petticoat. The insulating power of these insulators was thus hardly lessened by the weathering, per se; at least as far as it had then progressed.
b. A third weathered insulator with 1 1/4 in. (3.1 cm.) turned off the edge of the top petticoat flashed over at 108,000 volts, the arc passing through a check on the lower petticoat.
A few days after the completion of those tests, to try still other conditions, a further series of tests was made with results as follows:
Ninth Group. (Tests 25-27) High-Frequency Tests.
These were similar to the previous high-frequency tests, but with the insulator mounted on a wooden pin with tin foil wrapped around the pin up to a point 1/2 in. (12.7 mm.) below the insulator and grounded.
a. An insulator of the type of Fig. 2 punctured through the head, as before, on the ninth trial. This design of insulator (which insulator was newly made for this last set of tests) had previously flashed over the surface at 156,000 volts, dry, 60 cycles.
b. An insulator similar to Fig. 2 but with 12 in. (3.7 cm.) turned off the outer edge of the upper petticoat, punctured through the head, but only after 113 trials. This insulator was nearly at the safety point. This insulator previously flashed over at 129,000 volts, dry, at 60 cycles or at 103,000 volts, wet.
c. An insulator similar to Fig. 2, but with 21 in. (5.7 cm.) turned off the edge of the upper petticoat, resisted 150 trials without puncture. This insulator was found to flash over at 119,000 volts, dry, at 60 cycles and at 81,000 volts, wet, under the rain test already described.
 |
| Fig. 7 - Porcelain Insulator No. 3007 |
 |
| Fig. 8 - Porcelain Insulator No. 3002 |
Tenth Group. (Test 28).
The same high-frequency test on electrose insulators of the type shown in Fig. 4 showed no puncture in 150 trials. This insulator flashed over at 115,000 volts, dry, on 60 cycles and 76,000 volts, wet.
Eleventh Group. (Tests 29-30).
The same high-frequency test on a porcelain insulator of the type shown in Fig. 5 showed a puncture from the tie wire groove to the pin top, on the third trial in the case of one insulator, and on the second trial on another insulator. This type showed a flash-over at 118,500 volts, dry, at 60 cycles, in one case, and at 95,000 volts in a second case, and a flash-over of 70,000 volts, wet, on the first insulator.
These tests of groups 9 to 11 show that the use of a wooden pin, extending only a short distance out from the threaded portion of the insulator, considerably increased its power to resist the high-frequency stress. This result must be due to the prevention of the ground potential from getting up inside the insulator, so to speak. Its effectiveness is, however, somewhat limited by the fact that extremely severe potential shocks, such as were here produced, tend to cause a discharge over the surface of the pin into the insulator pin recess. If this pin were cemented air-tight into the insulator the result would presumably be to increase the power of the insulator to stand high-frequency tests.
Certain other tests which are of interest were made to measure the actual voltages reached on the insulator during discharge. Measurements were made by noting the voltages that were required to jump the spark gap marked "measuring gap" in Fig. 11, under certain discharge conditions.
a. During the high-frequency test on a Fig. 2 insulator, (test 8), sparks were observed in the measuring gap when it was set at 10 in. (25.4 cm.), 104,000 volts, (needle points) but no sparks occurred when it was at 11 in. (27.9 cm.), 112,000 volts. There were 125,000 ohms (seven composition sticks) in the shunt measuring gap circuit when these readings were taken. This indicates a maximum voltage during the high-frequency attack of slightly over 100,000 volts. This result, which should be compared with the 150,000 (15-in. or 38-cm. gap) necessary to make the insulator flash over at 60 cycles, shows that there must have been a great local concentration of voltage on portions of the insulator at the high frequency. This is an important point in connection with surges produced by internal causes. If a 100,000-volt static voltage will pass over or through an insulator which flashes over at normal frequency only on 150,000 volts, this fact should be recognized.
b. With the same arrangement as in "a" above, except that the insulator was short-circuited by a No. 18 copper wire, drawn tight between pin and tie wire groove, a voltage sufficient to jump a needle gap corresponding to 15,000 volts was noted, and no spark occurred over the gap when set for 20,000 volts. No resistance was used in the measuring gap circuit in this test.
c. With the conditions of test "b" above, except that five separate No. 18 wires were used to short-circuit the insulator, located at points equally spaced around its circumference, a spark gap of 2 in., (12.7 mm.), corresponding to 10,000 volts, was jumped, but no spark was found with the spark gap set at a value to indicate 15,000 volts. No resistance was used in the measuring gap circuit in these tests.
DISCUSSION OF TESTS
The obvious meaning of these tests is of great import. Unless there is some reason for believing that the tests are only of limited application or are rendered misleading by some unobserved condition, they mean that many of the line insulators now in service may be expected to break down by puncturing under the attack of lightning rather than by discharge over the surface, which latter is recognized as the desired characteristic. And this in spite of the fact that these insulators may have been thoroughly tested on normal frequencies in the usual way and may have then always flashed over the petticoats as intended. The fact shown in these tests, that an insulator which did not puncture at 250,000 volts on 60 cycles (under oil), punctured after a comparatively few shocks of high-frequency discharge, and without apparently opposing a resistance of much over 100,000 volts (10-in. (25.4-cm.) spark gap), shows how little can be determined from the 60-cycle tests, as to the lightning-resisting capacity of an insulator.
While none of the tests were on trains of suspension insulators, the question immediately arises whether the same effects, that is, local concentration of voltage with high-frequency shocks, will not cause these insulator trains to puncture relatively easily from lightning even when withstanding satisfactorily the most severe tests of the usual sort. Such failure is very likely to be expected. High-frequency tests on such insulator trains should be made by all means, and without delay.
The conclusion also is forced upon us, that if high-tension line insulators are to be adapted to resist lightning to the best advantage, the design of many of them should be radically changed. Such a design study will require much patient investigation. In view of the importance of these conclusions, a critical examination of our tests was made for the purpose of discovering any improper methods or errors that might account for the great weakness of the insulators under high-frequency shocks; nothing, however, so far has been found to explain more than a very small portion of the very great discrepancy between the results of the two types of tests.
Considering the material of the insulators, most of which were electrose, we should say that insulators made in at least four different lots, distributed over a period of several years, showed the same consistent behavior. Further than this, four different types of porcelain insulators were tested and all showed this effect, although the lower-voltage insulators showed it in a less degree than the higher-tension insulators. In the case of the insulators of Fig. 4 and Fig. 5 the shape of the insulator was the same and only the material was different. Of these, the electrose insulator behaved best on the high-frequency test.
One very significant point is that no insulator failed on high frequency on the very first shock. In fact the strain of repeated shocks seemed to be far more severe than that of a few. Probably there is a progressive hammering out of a path through the solid material of the insulator. It will be immediately suggested that this effect may be due to a progressive heating of the material by conduction or dielectric hysteresis, but we are inclined to doubt this. Investigations were made by exploring with the finger during the tests, and, while after a puncture, which would of course be followed by some arcing, there was often a very noticeable rise of temperature at the puncture, exploration before an actual puncture but after the occurrence of many shocks showed no detectable preliminary heating. Furthermore, there seemed to be no difference in the behavior of electrose and porcelain. This matter of dielectric loss and heating is of course one of the matters that should be carefully followed up in future tests along these lines. If the effect of the greatly increased severity of many shocks was due to the heating effect, it is not likely that the cutting off of the petticoats would be so effective in increasing the resisting power.
It has been suggested by some that porcelain deteriorates in quality with time or exposure to the weather. This hypothesis is supposed to explain the fact that insulators which stand up under tests and during the initial months of actual service then seem to fail far more readily at a later time. It is suggested by the behavior of the insulators of our tests that there was progressive deterioration under the intense stresses of these experiments (or under the attack of lightning in actual service), which, while due to electrical forces, are of a physical nature. This would be somewhat analogous to the well-known mechanical disintegration of the surface of glass under repeated surface sparking. In this view, the repeated attacks of these tests represent the anticipated effect of several seasons of lightning storms; to put it another way, the tests serve as a measure of the service durability of an insulator, as far as lightning and static are concerned.
These tests were made in a large transformer testing pit, but it is not likely that the presence of the grounded sides of the pit several feet away could have had any material effect on the results.
While the 60-cycle tests and the high-frequency tests were made on different testing outfits, there can be no great error here. The 60-cycle tests were made on a 300,000-volt transformer, regularly and frequently used for such testing, and the ratio and spark gap methods of measuring the high-tension voltages were about five per cent apart, the voltage actually reported being the spark gap voltage as recommended by the Standardization Rules of the A. I. E. E. The character of the high-frequency tests was of course determined by the series spark gap and the constants of the plate condenser discharge gap. The high-tension condenser had approximately 72 sq. ft. (6.7 sq. m.) surface and a dielectric thickness of 42 in. (1.06 m.) of air. The discharge path of the condenser was roughly rectangular in form, 5 by 7 ft. (1.5 by 2.1 m.), including the series gap and the insulator itself.
An estimate of the natural oscillation frequency of this discharge circuit would be, roughly that it was of the order of 1,000,000 cycles per second or higher. The noise of the discharge during the tests was very loud and some of the observers used cotton in their ears to avoid the disagreeable physiological effect. While the highest voltage of the high-frequency tests was in the neighborhood of 300,000-350,000 volts, and the quantity of the discharge great for laboratory tests, it was of course far short of lightning conditions in both particulars. The frequency, however, may have been comparable with that of lightning.
The probability of the trustworthiness of these tests is greatly increased by the behavior of insulators in actual service, where punctures of a surprising character have occurred at the time of lightning or other disturbance of a static nature. We are informed that trains of suspension insulators and also pin type high-tension insulators which are carefully designed and shown by test at normal frequency to flash over before they puncture, still do in practise actually puncture under lightning strains. It is a fact, however, that many of these insulators at other times do actually flash over in actual service instead of puncturing under static stress, showing that either all insulators or all stress conditions are not the same. This matter cannot be finally cleared up without much experiment and research.
Cause of the Peculiar High-Frequency Effects. Of the most interest and importance is of course the explanation of the cause of the great observed discrepancy between the effect of high-frequency tests and commercial frequency tests. It is too early to speak with certainty, but there is little doubt that the principal cause is the concentration of potential with high frequency upon some local part of the insulating material, with the result of the breaking down of this portion and the throwing of the potential on some other part which is then also broken down. This general phenomenon is well known in related situations; for example, in the behavior of trains of small air gaps in high-tension lightning arresters.
If a resistance and a capacity are connected in series and so adjusted that a given voltage at 60 cycles is evenly divided between the two, and the same voltage at a much higher frequency is impressed on the two, it will be found that the resistance then receives nearly all the voltage and the condenser practically none at all. The same would be true to an even greater extent were an inductance substituted for the resistance. An adjustment may easily be arranged in which at 60 cycles the condenser will take all the voltage and at the high frequency the resistance would take all the voltage. In applying this principle to insulator service, it must be remembered that the change in frequency between 60 cycles and the frequency of lightning is enormous, the ratio being somewhere of the order of 1 to 1000 or 10,000, which gives range enough to permit even a small tendency of 60 cycles to be transformed into a dominating effect on the lightning frequency.
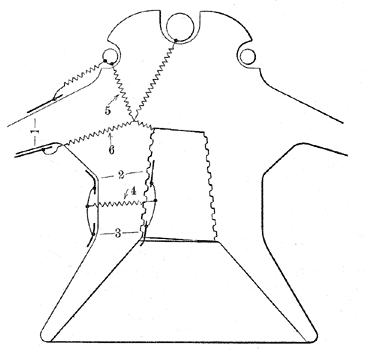 |
| Fig. 9 - Illustration of Electrostatic Capacity of Surface and Insulation Resistance of the Various Parts of the Insulator |
Consider Fig. 9; the small condensers indicate the capacity of various parts of the insulator surface to which the potential of these parts is due, and the small resistances indicate the insulation resistance of the corresponding dielectric material of the insulator. At 60 cycles, the charging current for the several small condensers, 1, 2, 3, can easily flow through the several resistances, 4, 6, etc., without the impressing of any very great potential upon these resistances. With a high frequency, however, as just explained, the full potential may be impressed on the resistance for the moment, or, in fact, for as long as the high frequency lasts. Thus the resistance 4 which charges the surface capacity 1, which is a relatively large capacity, may on high frequency have to support nearly the full voltage of the attack, which it is evidently not adapted to do. But there is also a leakage of current toward the tie wire and conductor which will flow over part of the path of the resistance 4. Since the surface of the pin is much smaller than that of the surface of the insulator, the concentration of leakage current will be greatest at the former and the first break or failure of the insulating material will occur at this point. When this occurs the voltage on the conductor and tie wire will tend to cause a puncture through this weakened material and thus make a puncture from the conductor to the edge of the top of the pin. This is what was actually observed. This explanation is, however, given rather as illustrative of the general tendency of the distribution of force, than as a correct picturing of the action in detail, for this would be very hard to establish directly.
According to this view the effect of the lead foil of test 24, which showed a great strengthening of the insulator's resistance, was to permit the charging of the small condenser 1 through the foil in virtue of the capacity of the foil to the pin and in virtue of the fact that a free charge of Opposite sign could be repelled to the lower end of the foil. So far as it goes, then, the foil test tends to confirm the distribution of potential assumed above in connection with the discussion of Fig. 9.
Looking at this matter from another point of view, which, however, in substance is much the same, it is evident that the conductor and the wire on the top of the insulator form the electric equivalent of a hemisphere, and that the pin top is in effect a small discharge point near the center of the hemisphere. This form is one in which the distribution of electric field is most uneven, for its intensity is greatly concentrated at the center on the pin top, and much less intensity exists at the conductor and the tie wire. This condition is somewhat similar to that of a cable with a lead sheath and a relatively small conductor inside. It is found, in such a cable, that if the diameter of the conductor is smaller than that of the sheath by more than a certain ratio, little gain in insulation strength is made by increasing the thickness of the insulation and the diameter of the sheath. This is because the potential becomes more and more concentrated at the center and this part fails first, so that the added insulation is later broken down by itself. However, in the case of the tests here described, the effect of resistance and capacity in series, assumed in the discussion of Fig. 9, is probably present, for this sort of concentration comes from high frequency only, while that described in connection with cables occurs at all frequencies. It is significant that the use of a metal cap only weakens the insulators in the tests (see tests 20 and 21), as would be expected from these explanations.
High-Frequency Tests. It will naturally follow from the conditions indicated by these tests, assuming that they are confirmed by later investigators, that it will be desirable to modify our methods of testing insulators for practical work by adding tests of their behavior on high frequency. Such tests presumably need not be made on all the insulators entering into a plant, but on each type, to show that the design is satisfactory. Such tests will be difficult to make, in the first place, because very high voltage and large capacity are necessary for making the tests, and second, because these tests are dangerous to the testing apparatus used and because so far there is no knowledge as to what limits of frequency, voltage, electrostatic capacity or number of repetitions of attack are necessary to give a proper measure of the conditions of actual service. These service conditions will undoubtedly vary greatly in different localities. It can only be suggested here that further study of these phenomena be made as speedily and as exhaustively as practicable.
Design of Insulators. In the matter of new designs of insulators to resist high-frequency discharges, much research should be done, but there are some guiding principles already clear. First, the more widely the live conducting parts of an insulator are separated from the pin, the less will be the stress. Second, the more nearly uniform the electrostatic field between these elements is, the better the condition. Third, wide and thin petticoats add very little strength to the high-tension insulator, for the electrostatic capacity of the surfaces of the outer parts is very great with regard to capacity of the parts nearer to the pin. It is very likely that the capacity of the wide petticoat of the insulator of Fig. 1 or Fig. 2 plays little part in its behavior on high frequency, since the potential stresses may be transmitted through the petticoat by virtue of the capacity of the lower surface in relation to that of the upper surface. This would account to some extent for the behavior observed. It is significant that the type which stood best, that of Figs. 4 and 5, had short and thick petticoats placed low down with regard to the pin top. The heavy ball of insulating material at and around the head of the pin is very likely the chief reliance of the insulator on high frequency.
It will be noted that the design of the present suspension insulator has some points of disadvantage from the point of view of static stresses, if these tests are to be relied upon.
Effect of High Frequency on Lead-Covered Cables. From the analysis of the necessary effects of applying very high frequency to structures having electrostatic capacity and high resistance in series, it is suggested that these high-frequency strains may have a very trying effect on lead-covered cables. Here the layers of the insulating material next to the conductor may receive a far greater concentration of potential from high-frequency stresses than from 60-cycle stresses, for example; in which case static disturbances may break them down at a lower voltage than under normal conditions. As the great susceptibility of cables to static disturbances has been frequently observed in actual service, a series of cable tests after the type of those here reported would be of the greatest interest.
The great difficulty in such tests would be to get some reliable measure of the equivalence of voltages at high frequency and low frequency.
 |
| Fig. 10 - Section of Insulator Finally Adopted |
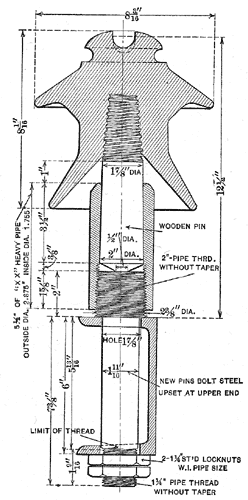
Fig. 10 shows the insulator and pin finally adopted by the power company. The pin consists of an iron base for attachment to crossarm, and metal sleeve with conical bore to receive a wooden pin, which is secured in place by the pressure produced in screwing the sleeve and base together. The wooden pin is Impregnated with bakelite to prevent absorption of moisture.
No attempt was made to cement the pin in the insulator, but this can readily be done if experience indicates that it is desirable. The insulator thus mounted on the combination wood and iron pin will withstand a breakdown test at 60 cycles between a conductor in the tie-wire groove and the iron pin, of 120,000 volts, dry, and 85,000 volts, wet. It is highly probable that if time had permitted, a better design of insulator could have been developed, but the construction of a new line was under way and the order for insulators had to be placed. The design selected was that which our tests had shown to be best able to resist the high-frequency discharges which we were able to obtain in the laboratory. It remains to be shown by experience whether these insulators will resist puncture from all lightning discharges to which they will doubtless be subjected.
 |
| Fig. 11 - View of High-Frequency Testing Arrangements |
Suggestions for Investigations. We would make the following suggestions, the application of which will be clear from what has been said above.
a. Those who wish to get an idea of the behavior of their insulators on high frequency without waiting until a generally accepted test is developed, should utilize the arrangement of apparatus of the tests here described, which has been found very satisfactory and as practicable as any is likely to be.
b. Those who wish to do research work on this line of investigation, should study:
1. The effect of frequency itself on some standard type of test insulator, by varying the constants of the high-frequency discharge circuit.
2. The effect of high frequency on trains of suspension insulators.
3. The effect of the distribution and size of petticoats and the control of the potentials of various parts of the surface of the insulators, for example, by the use of conductors distributed on the surface, as in the above lead-foil test, and especially the location of the petticoats with regard to the top of the pin and the thickness of the base of the petticoats.
4. The effect of a wooden or other insulating pin. Especially the effect of cementing the pin air-tight in the socket. With a wooden-topped pin and an insulator so mounted and shaped that any discharge would take place to the crossarm and not to the pin, many of the electrical advantages of a metal pin would be obtained, with probably greatly increased possibilities of resisting puncture by lightning.
5. The high-frequency test as a test, to determine the effect, on the behavior of any insulator, of variations of test frequency, of the amount of the excess series gap voltage over and above the flash-over voltage of the insulator, of the amount of static capacity connected with the high-frequency discharge circuit, of the length and character of the discharge path, and the effect of the method of securing the actual conductor and tie wire during the test.
In conclusion we would state these tests are reported to the Institute for their great interest and suggestiveness, but with the full consciousness that they are far from complete from the broad point of view of the effect of high-frequency voltages on high-tension insulators.
