[Trade Journal]
Publication: Journal of the American Institute Of Electrical Engineers
New York, NY, United States
vol. 39, no. 7, p. 623-630, col. 1-2
Electrical Characteristics of the Suspension Insulator--II.
The Line Insulator at the Higher Voltages
BY F. W. PEEK, Jr.
General Electric Co., Pittsfield, Mass.
IT is the purpose of this paper to review the duties of the line insulator at voltages above 100 kv. and compare them with the duties imposed by the lower voltages. It seems desirable to do this at the present time in order to predict the reliability of future high-voltage lines as compared with those at present in operation, and to point out what changes, if any, are necessary in present practise. The discussion is based in general upon data and operating experiences of many investigations and, in particular, upon extensive investigations made by the author during the last few years. Quite complete data on that phase of the author's investigation dealing with voltage distribution will be given.
PRESENT STATUS
At the present voltages the problem is primarily a mechanical one. Mechanically, porcelain would never be selected as a line support. It is unreliable in tension, subject to cracking, and if made in large pieces subject to porosity. The greatest care is necessary in manufacture to secure a uniform, tough, non-brittle material, free from porosity. Unfortunately it is the only material that we know of at the present time that will withstand the weather without the carbonization and deterioration of organic compounds under the electrical stress.
Generally after three to five years of more or less successful operation, insulators selected by the most careful electrical tests begin to fail rapidly. There are of course exceptions, but the experience is quite general and most operating companies anticipate breakdown by periodic tests designed to weed out faulty units.
The apparent deterioration of porcelain is generally due to one of the following causes:
1. Gradual mechanical cracking, due to expansion of cement or tight-fitting metal parts, or to internal firing strains or brittle porcelain.
2. Gradual absorption of moisture due to porosity.
The greater part of the trouble has been due to cracking under stresses caused by expansion of cement or of tight-fitting or cemented-in metal parts. Cracking may also be caused by uneven expansion in very thick porcelain parts of different shapes.
The foregoing causes of deterioration are well verified in practise, because the type of insulator in which the porcelain units are strung together by loose fitting metal parts or cables shows no deterioration after ten years or more of service. This was found to be so even when some of the earlier units were made of poor material. The absorption of moisture seems to be due to a considerable extent to breathing. The presence of a damp sponge of cement is thus also undesirable from this standpoint as it keeps moist the air breathed by the porcelain.
The solution of the deterioration problem seems to be to start with a design as free as possible from expansion troubles and the selection of a tough, non-porous porcelain. Years of service have been the best criterion of design. Regarding the selection of material, no present, practical electrical test will anticipate future cracking due to internal strains or brittle porcelain or will indicate porosity in dry porcelain. The desired results can probably best be attained by testing a small percentage of the product to destruction from day to day after the usual electrical and inspection tests have been made, the object being to determine if the product is up to the standard and of uniform quality. This idea is not new, but is used in the manufacture of lamps and in other industries. Electrical, mechanical and porosity uniformity tests are necessary. Extremely accurate tests are not necessary, but it is necessary to have tests that can be quickly made so that any fault can be at once detected and remedied.
In our investigation we made first the electrical tests, followed by mechanical impact tests to destruction. Samples were then taken from the head and thick parts of the units and subjected to a porosity test. In this test the samples were placed in a dye solution under pressure, after which the depth of penetration was noted. The porcelain was placed in three arbitrary mechanical and porosity grades and a graphical chart made indicating the percentage in each grade as shown in Fig. 1. We found this method of great use not only in checking the product and comparing different materials, but also in studying deterioration of insulators in service.
INSULATORS FOR THE HIGHER VOLTAGES
The problem of deterioration discussed above is independent of the voltage. Its effect on operation should be less at the higher voltages because of the greater number of units used in a string. There are, however, certain factors unimportant at the lower voltages, which become of increasing importance as the voltage is increased.
 |
| Fig. 1 Sample Sheet Showing Method of Plotting Electrical Mechanical and Porosity Tests. |
Uneven Voltage Distribution,. It has long been known that when insulators are placed in series in a string the arc-over voltage is not the sum of the arc-over voltages of the individual units, but less. This is due to the uneven division of voltage on the different units. A very high percentage is across the unit nearest the line. Typical curves are given in Fig. 2. Fig. 3 shows the percentage of the total voltage across each unit of a string of ten. Even distribution would put 10 per cent on each unit as indicated by the dotted line. It will be noted on examination of Fig. 2 that for strings over five units in length, there is always about 30 per cent of the total voltage across the insulator nearest the line. This will vary from 20 to 30 per cent with different types of insulators and with different hardware on the same type. The importance of a consideration of this factor at the higher voltage is at once seen since the maximum unit stress increases directly with the voltage. At 100 kv. the operating stress on the line unit is 17.4 kv.; at 220 kv. it is 38 kv., which is higher than is desirable. It is desirable to lower the operating stress on the units near the line.
 |
| Fig. 2. Typical Voltage Distribution Curves on Strings of Suspension Insulators. |
 |
| Fig. 3. Voltage Distribution on String of Ten Insulators |
A mathematical analysis of the cause of uneven distribution has already been given. It seems best, however, to give here an elementary review of the causes of uneven distribution in order better to discuss the methods of remedying it.
A string of line insulators may be considered as being made up of a number of capacities in series. There is also capacity from the hardware and fittings of each unit to ground. The capacity may be represented diagramatically by Fig. 4. This arrangement is approximate, but suitable for the purpose of illustration.
 |
| Fig. 4. Cause of Uneven Distribution. the Capacities to Ground C1 Cause An Uneven Distribution of Current Through the Insulator Capacity C2. |
It is at once apparent that the capacity currents cause unequal voltage distribution. If i is the total current through the first insulator, the capacity current through the second one from the line is i i1 is the capacity current to ground; and third from the line i 2 il; the fourth i 3i1 etc. The current and, therefore, the drop is greatest on the line unit; the current decreases successively on each unit from the line by the current to ground of one unit. Correction of voltage distribution may be made by eliminating the effect of the ground current or the capacities to ground, C1.
 |
| Fig. 5. Grading by Making Internal Capacity of Insulator Units C2 Large Compared to the Capacity to Ground C1. |
 |
| Fig. 6. Grading by Changing the C2 Capacities in Proportion to Their Respective Currents. |
This may be done by any one of the following methods:
1. Increasing all of the C2 capacities without increasing the C1 capacities so that the effect of the current to ground is relatively less. See Fig. 5.
2. Increasing the C2 capacities of the insulators along the string in proportion to the currents flowing through them. This means highest C2 capacity on the however, to give here an elementary review of the causes of uneven distribution in order better to discuss the methods of remedying it.
A string of line insulators may be considered as being made up of a number of capacities in series. There is also capacity from the hardware and fittings of each unit to ground. The capacity may be represented diagramatically by Fig. 4. This arrangement is approximate, but suitable for the purpose of illustration.
It is at once apparent that the capacity currents cause unequal voltage distribution. If i is the total current through the first insulator, the capacity current through the second one from the line is i iI where is the capacity current to ground; and third from the line i 2 il; the fourth i 3 etc. The current and, therefore, the drop is greatest on the line unit; the current decreases successively on each unit from the line by the current to ground of one unit. Correction of voltage distribution may be made by eliminating the effect of the ground current or the capacities to ground, C1.
This may be done by any one of the following methods:
1. Increasing all of the C2 capacities without increasing the C1 capacities so that the effect of the current to ground is relatively less. See Fig. 5.
2. Increasing the C2 capacities of the insulators along the string in proportion to the currents flowing through them. This means highest C2 capacity on the line unit, less on the next unit, etc. See Fig. 6 This is generally called grading.
3. Elimination of the ground capacities by means of an antenna shield from the line. See Fig. 7. This may be called shielding.
 |
| Fig. 7. Grading or Sheilding by Eliminating the Effect of the Capacities to Ground. |
 |
| Fig. 8. Voltage Distribution on String of Ten Insulators. |
In order to get appreciable results by method 1, it is necessary to add capacities with solid insulation, or plates in intimate contact with the porcelain. Plates along the string will not help materially, as the percentage increase in the C2 capacities will generally be smaller than the percentage increase in the C1, capacities.
Method 2 is practical but it must be accomplished by adding capacities with solid insulations. In practise it means the addition of metal caps or plates in intimate contact with the units, or varying the wall thickness of units, or placing a varying number of units in multiple along the string, or using different sizes of units. Very good results can be obtained by this method. Its undesirable feature is that it requires different kinds or sizes of units in the same string. Figs. 8 and 9 show the voltage distribution in a string graded by placing different sizes of caps along the string.
| |||
| Fig. 9. Grading by Metal Caps. |
 |
| Fig. 10. Shielding by Eliminating the Effect of the Capacity to Ground. |
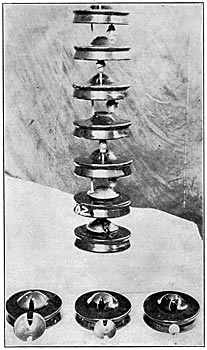
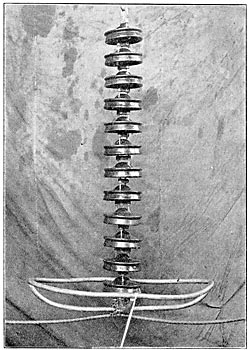
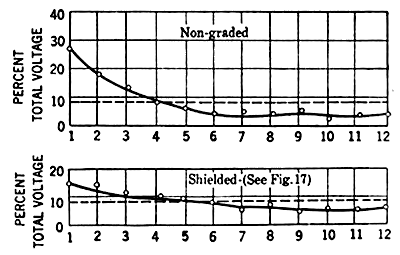
Very good voltage distribution can be easily obtained by method 3. The ground capacities may be thought of as being due to grounded antenna extending along the string. The effect of this antenna may be eliminated by a similar antenna connected to the line and extending along the string as in Fig. 10. In practise the antenna is the very simple shield shown in Fig. 11. The hardware shown in Fig. 11 is not standard but was selected for laboratory purposes to give the worst distribution. The shield readily corrects it. The maximum unit stress would be less on a 220-kv. shielded string than on present non-shielded strings operating sucessfully at 100 kv. and less. The distribution with and without the shield is shown in Fig. 12. A standard hardware giving better distribution with and without the shield is shown in Fig. 13.
| |||
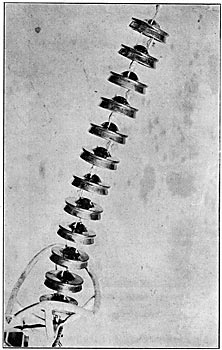
| Fig. 11. Antenna Shield for Equalizing Voltage on Insulators. (Laboratory Hardware) |
 |
| Fig. 12. Voltage Distribution on A String of Twelve Insulators. (See Fig. 11 Laboratory Hardware.) |
This method requires no special units. The antenna has an additional advantage of acting as a corona shield, eliminating corona from the string and tending to keep the power arc from the insulators and from burning the conductors. Even if the voltage were evenly distributed a corona eliminating shield would be advisable at the higher, voltages.
Heretofore the main argument given for equalizing voltage distribution has been to reduce the string length by increasing the arc-over voltage for a given number of units. It is much more important to reduce the operating stress on the line-end units.
| |||
| Fig. 13. Antenna Shield. Insulators Strung With Standard Hardware. |
With certain types of units the wet arc-over voltage may be higher than the dry arc-over voltage for long strings. This is because rain may assist in grading a badly unbalanced string. As a general rule, a string cannot be very greatly shortened in practise by grading because of the effects of rain, dirt, etc. on the perfectly graded string. There would be little gain in increasing the dry arc-over voltage if the wet arc-over voltage were decreased. Rain would not increase the wet arc-over voltage of a graded string. The wet arc-over voltage would generally be lower if the string length were decreased.
There is an additional reason why grading will generally not make possible an increase in the arc-over voltage or a decrease in the string length. For any unbalanced string there is more or less complete automatic grading as the arc-over voltage is approached. Near arc-over excessive corona forms on the line unit, to a less extent on the next unit, etc. These sheets of corona act as capacity plates and grade the string, thus automatically raising the arc-over voltage. If this were not so, it would be expected that the arc-over voltage for the non-graded string above could for five or more units, never be higher than 1/0.30 = 3.3 times the arc-over voltage of a single unit. As a matter of fact, it is much higher, due to the automatic grading of corona.
The wet and dry arc-over voltage of insulators decreases almost directly with barometric pressure. The insulator problem for the higher voltages is therefore more difficult at higher altitudes.
It has been found that the wet lightning arc-over voltage is usually as high as the dry lightning arc-over voltage. The lightning arc-over voltage is, to a great extent, a question of string length. If the string length is decreased due to grading the lightning arc-over voltage will also be decreased.
| |||
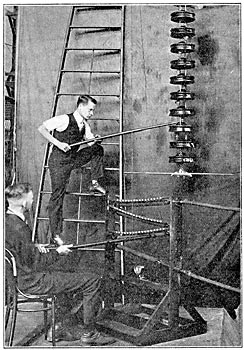
| Fig. 14. Method of Making Distribution Measurements. |
TESTS
It may be of interest to describe the method of making tests. A water resistance with 50 taps was placed across the line in parallel with the insulators as shown in the illustration, Fig. 14. Each tap had a fixed and known potential above ground, i. e., a given percentage of the applied voltage. Connection was made between the particular unit, the potential of which was being investigated and various taps on the resistance until a tap was found of the same potential. In making this measurement a wire was fastened to a tap and the other end of the wire fastened to a steel point at the end of a fibre rod. When the rod was brought up to the cap a spark would indicate a difference of potential. The connection on the tap was then changed, or the operation was repeated until no spark occurred when the point touched the insulator cap. It was found that the steel point, because of the color of the spark, indicated the smallest difference of potential. In making measurements it is necessary to prevent as far as possible any distortion of the field by the wire and point. A distortion is indicated by different potential readings when measurements are made at different points around the insulator. A stream of water was kept running through the tube in order to keep the temperature constant. Approximate potential readings can be obtained by placing a very small gap shunting a forked stick across the units. This method gives fairly accurate results on the two or three units near the line, but quite inaccurate results on the others.
 |
| Fig. 15. the Effect of Proximity to Walls. Voltage Distribution on String of Five Insulators. |
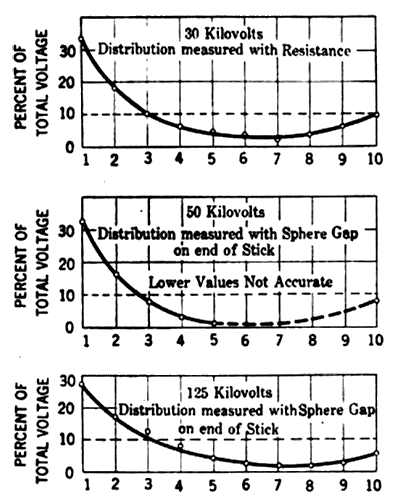 |
| Fig. 16. the Effect of Applied Voltage on the Distribution of A String of Ten. |
The effect of proximity to tower, etc., is given in Fig. 15. It will be seen that it is not great. The effect of corona on distribution is not great at the operating voltage. For instance there is very little difference in the voltage distribution between 30 and 130 kv. 130 kv. is approximately the voltage to neutral of a 220-kv. system. Fig. 16 shows the distribution at 30, 50 and 125 kv. The 50 and 125-kv. curves were made with a spark gap and are accurate for the three units near the line only. Fig. 17 shows the shield used on a double string. The distribution is very good as shown in Fig. 18.
| |||
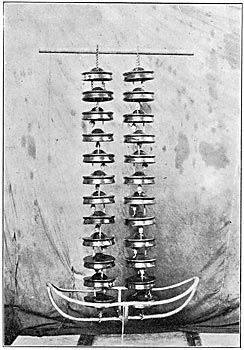
| Fig. 17. Antenna Shield on A Double String. Laboratory Hardware See Fig. 18. |
 |
| Fig. 18. Voltage Distribution on Two Parallel Strings of Twelve Insulators. |
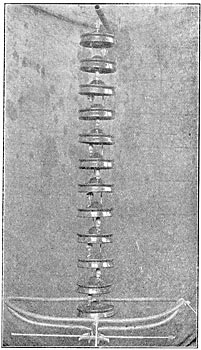
Figs. 19 and 20 show the shield and distribution on other types of units. A corona shield is also desirable on this type at 220 kv. The effect on voltage distribution of placing a shielded string in a horizontal position was investigated and found to be negligible. See Fig. 21.
| |||
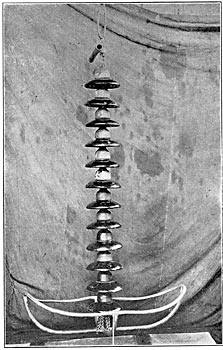
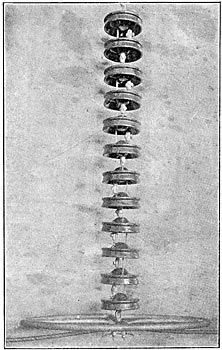
| Fig. 19. Antenna Shield. (See Fig. 20.) |
 |
| Fig. 20. Voltage Distribution on String of Twelve Insulators. (See Fig. 19.) |
| |||
| Fig. 21. Antenna Shield for Equalizing Voltage on Insulators. |
The method of grading shown in Fig. 22 was not found to be very satisfactory.
Fig. 23 shows a form of shield that gave fairly good results.
| |||
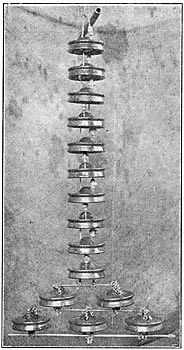
| Fig. 22. Two and Three Units in Parallel at Line End of String of 12 Units As A Means of Improving Voltage Distribution on the String. |
| |||
| Fig. 23. Antenna Shield for Equalizing Voltage on Insulators. |
Distribution tests were made to see if there would be any disturbing effect due to the proximity of other insulator strings as in operation on a three-phase line. There was found to be no appreciable effect.
It is not possible to show all of the various shields tried, but it is believed that the above fairly well covers the field.
SUMMARY
From the above discussion it may be concluded that:
Insulator troubles have been due mainly to cracking caused by expansion of metal parts, cement, etc. and to porosity.
Certain designs with loose-fitting parts have been free from deterioration. Other designs should be so modified as to relieve them as far as possible from expansion troubles.
Tough non-porous porcelain is desirable.
The old method of basing everything on electrical tests should be abandoned. Severe electrical tests are often harmful. The electrical strength is often secondary to other characteristics. An electrical, mechanical and porosity uniformity test should be established, in which a small percentage of the product is tested to destruction from day to day to ascertain if it is running brittle or porous or is weakened by firing strains.
For the very high voltages that are at present being considered, greater reliability may in many respects be anticipated than for the lower voltage lines. The lightning arc-over voltage and dielectric strength will be relatively higher and induced lightning voltages, sufficient to cause arc-over, will be less than on low? voltage lines. Increasing the number of units in series decreases the probability of complete string failure.
Uneven distribution of voltage on the string becomes more serious at the higher voltages because of the high stress on the unit near the line. For strings of more than four or five units the stress is practically a constant percentage of the operating voltage independent of the string length.
Uneven distribution can be corrected by shielding, shielding prevents excessive corona on the line end units and tends to direct the power arc away from the string. The maximum unit stress on a 220-kv. shield string can be made less than on a 100-kv. non-shielded string.
Briefly, outages due to insulator troubles will probably be less frequent at the higher voltages than at present.
The author acknowledges the assistance of Mr. W. L. Lloyd, Jr. in making this investigation.
