[Trade Journal]
Publication: Bell System Technical Journal
Short Hills, NJ, United States
vol. 9, no. 4, p. 730-759, col. 1
The Transmission Characteristics of Open-Wire Telephone Lines (1)
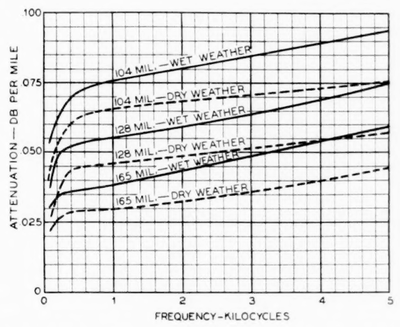
By E. I. GREEN
Values of the primary transmission constants R, L, G, and C for open-wire telephone lines are presented, and the factors which affect these constants in practise are discussed. are Consideration is then given to the constants which of principal interest in telephone work, namely, the attenuation, the characteristic impedance, the phase constant, and the velocity of propagation. Data regarding these characteristics are given for the frequency range from 0 to 50,000 cycles.
NEARLY 3,000,000 miles of open wire are now furnishing toll service in the Bell System, and this total is increasing at a rate of more than 100,000 miles a year. Hence, the subject of the transmission characteristics of open-wire circuits, in addition to being of considerable natural interest, is of no little importance in many branches of tele- phone work. In the design of apparatus to be associated with the open-wire circuits as well as in the engineering and maintenance of the facilities derived from them, a knowledge of these transmission characteristics is indispensable.
The problem of determining the characteristics of the open-wire circuits selves, has, and of course, been coexistent with the circuits them- hence dates back to the beginnings of telephony. Of late years, however, there has been a very decided change in the nature and scope of the problem. This has resulted from many factors, particularly (a) the extensive application of carrier telephone and telegraph systems (2) and (b) the constantly increasing length of the long distance circuits. The first of these factors has extended the transmission range upward from about 3000 cycles to about 30,000 cycles, and may well extend it higher in the future. The second, in combination with the higher standards which are now applied in long distance transmission, has required greater accuracy in the data, emphasizing especially the importance of time and space variations in the characteristics. Also, recent changes in the construction of open-wire lines (to be described later) have necessitated substantial additions to the data.
There will be studied in this paper those inherent characteristics of open-wire lines which are used most frequently in telephone transmission work. These characteristics are: first, the attenuation, second, the impedance, and third, the phase characteristic, with which must be coupled its near relative, the velocity of propagation, The range of frequencies to be covered is fixed on the one hand by the d.-c. telegraph systems, as well as by the program transmission circuits, whose lower frequencies extend to 100 cycles or less, and on the other hand by the carrier telephone and telegraph systems, which make the range up to about 50,000 cycles of interest.
LINE CONSTRUCTION ARRANGEMENTS
In order to study the characteristics of open-wire lines it is necessary to know something of the constructional arrangements which are employed. The conductors most commonly used for the open-wire telephone lines of the Bell System are of 165-mil (No. 8 B. W. G.), 128-mil (No. 10 N. B.S. G.), and 104-mil (No. 12 N. B.S. G.) hard-drawn copper. These are the conductors usually employed for carrier systems. Other gages of copper, as well as a small amount of iron or steel wire, are used to some extent for voice-frequency and d.-c. telegraph transmission only,
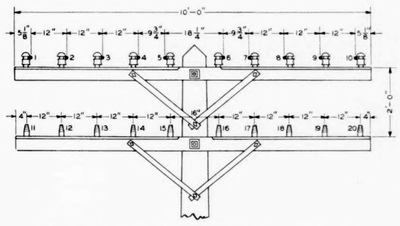 |
| Fig. 1Configuration of An Open-Wire Line With 12-In. Non-Pole Pairs. |
The wires of the lead (as an open-wire line is frequently designated in telephone parlance) are strung on poles, the normal spacing and numbering of wires being generally as shown in Fig. 1. Starting at the left end of the crossarm, the adjacent horizontal wires are grouped in pairs, wires 1 and 2 comprising one pair, 3 and 4+ another, etc. The characteristics of the pairs are of primary interest. Phantom circuits, which are derived from two pairs or side circuits, will be discussed later. The two wires of each pole pair (that is, a pair which bestrides the pole) are about 18 in. apart, and those of each non-pole pair 12 in. apart.
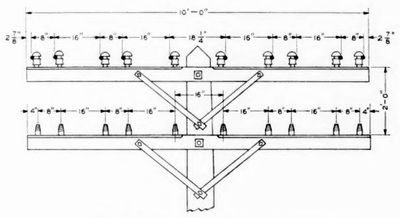 |
| Fig. 2Configuration of An Open-Wire Line With 12-In. Non-Pole Pairs. |
There has recently come into vogue a different arrangement of wires which is designed to reduce the coupling between circuits and thus permit a Maximum use of carrier facilities. This arrangement is portrayed in Fig. 2. In this newer configuration the separation between the wires of each non-pole pair is reduced to 8 in., and the horizontal separation between pairs is widened to 16 in.
The ordinary spacing between poles on open-wire toll lines is 132 ft., corresponding to a total of 40 poles per mile. Where additional strength is required, the number of poles per mile may be as high as 50, while outside of the heavy sleet area it may be as low as 30.
The types of insulators employed on open-wire lines will be discussed under the heading of leakage conductance.
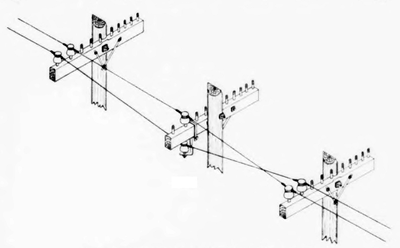 |
| Fig. 3Transposition of Wires With Drop Bracket. |
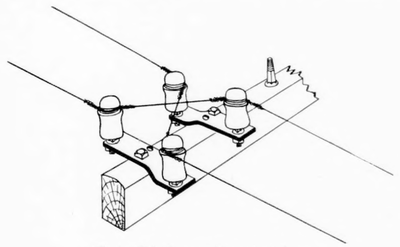 |
| Fig. 4"Point Transposition on Break Irons. |
Two methods of transposing the wires are in current use. In the older of these, which is illustrated in Fig. 3, the wires are brought at the transposition pole to a drop bracket. The transposition is accomplished over a total distance of two spans by gradually rotating the plane of the wires through 180 deg. It will be seen that the wire configuration is abnormal throughout the two spans. In the newer method, the wires are crossed practically at a point. This may be done by means of two brackets known as break irons, as illustrated in Fig. 4, or by means of a single bracket. The point transpositions preserve the nominal spacing between wires and thus avoid the irregularities in spacing which occur when drop bracket or rolling transpositions are used. With the point transpositions, however, two pairs of insulators are required at each transposition point as compared with a single pair of insulators at a non-transposition point. This results in an increase in the total number of insulators and in variations in the number of insulators on different pairs because of the different number of transpositions employed.
PRIMARY CONSTANTS
It should be noted here and now that the phenomena of line transmission are the same throughout all of the frequency range under consideration. Transmission over wires at high frequencies is accomplished in precisely the same manner as transmission at low frequencies, the wires acting as the guiding medium for the energy in both cases, and the same theory may be applied to both.
A review of the well-known theory for the propagation of alternating currents over wires will show that the line characteristics in which we are interested are dependent upon the four quantities known as the primary constants of the circuit. These are as follows:
R = Series resistance in ohms per mile.
L = Series inductance in henries per mile.
C = Shunt capacitance in farads per mile.
G = Shunt leakage conductance in mhos per mile.
These quantities may be stated per mile of wire or per mile of circuit. In this paper all values will be per mile of circuit, or, as it is commonly expressed, per loop mile.
Unfortunately the constants R, L, G, and C are by no means constant in practise. Indeed there could scarcely be a more fickle set of quantities. They are subject to change by a great variety of factors, of which the most important is, of course, the frequency. Hence it is evident that in order to determine the practical values of the attenuation, impedance, and velocity for open-wire circuits, we shall have to examine the behavior of the primary constants, R, L, G, and C.
RESISTANCE
First in the list of primary constants is generally named the conductor resistance. The method of computing the d.-c. resistance is well known and requires no explanation here. In such computations it is assumed that the current density is uniform throughout the cross-section of the conductor. With alternating current, however, the familiar phenomenon of skin effect tends to produce a non-uniform current distribution, and hence to increase the resistance. If the two wires of a circuit are close together, the effective a.-c. resistance of each wire is likewise increased by the presence of the parallel conductor, due to what is known as proximity effect. In cable conductors, especially when used for carrier frequencies, proximity effect is very important, but it is negligible in open-wire circuits because of the large separation between wires.
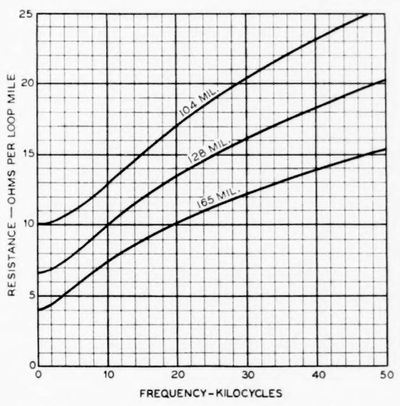 |
| Fig. 5A.-C. Resistance of Open-Wire Pairs at 20 Deg. Cent. (08 Deg. Fahr.). |
The method of determining the skin effect resistance of round wires is presented in various publications, and the theoretical results have been experimentally confirmed on numerous occasions.(3) Values of the a.c. resistance of 165, 128, and 104-mil copper pairs at 20 deg. cent., (68 deg. fahr.) determined in accordance with skin effect theory, are plotted in Fig. 5. It will be noted that the increase in resistance due to skin effect is small in the voice range, but rather astoundingly large in the carrier range, amounting at the higher frequencies to from 200 to nearly 400 per cent. Experimental evaluations of open-wire resistance are in extremely close agreement with the values given in Fig. 5.(4) For old wires, however, the resistance may be somewhat higher than these values. This is because of the presence of contact resistance in the twisted sleeve joints in the wires and also perhaps because of an actual decrease in the conductor diameter occasioned by corrosion. The increase in the d.-c. resistance of old wires due to these causes may be as much as 5 percent. The corresponding percentage of increase in the a.-c. resistance will, of course, be much smaller. The d.-c. resistance of a copper wire varies with temperature according to the familiar formula:
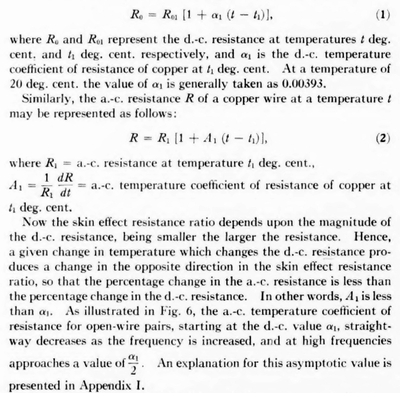 |
The temperature assumed by the conductors of open-wire lines depends of course, upon the weather conditions which prevail in different sections of the country. In order to obtain information on this subject, a study has been made of the Weather Bureau records for a number of representative cities in various parts of the country. The chief interest naturally centers in the extreme temperatures reached by the wires. It appears that on the average the air temperature will not drop below about -20 deg. cent. (-4 deg. fahr.) on more than about 10 days per year in the colder sections of the country, while a limiting temperature of about 35 deg. cent. (95 deg. fahr.) will not be exceeded on more than about 10 days per year in the warmer sections of the country. Because of imperfect radiation, the temperature of a wire in the sun will ordinarily exceed the temperature of the surrounding air by a small amount. A few tests have indicated that for open wires the increase over the air temperature on a warm day is not more than 5 deg. cent. Temperatures of -20 deg. cent. (-4 deg. fahr.) and 40 deg. cent. (104 deg. fahr.), therefore, appear to be representative values for the limiting temperatures assumed by open-wire lines. Reference to Equation (1) shows that this range of temperature gives possible variations in the d.-c. resistance of 16 per cent below and 8 per cent above the value for 20 deg. cent.
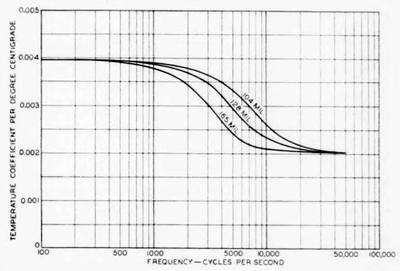 |
| Fig. 6A.-C. Temperature Coefficient or Resistance for Open-Wire Pairs at 20 Deg. Cent. |
The total annual change in resistance at any one place will, of course, be less than the sum of the above changes. In the Middle West, however, where the weather variations are much greater than in other parts of the country, the total annual change in d.-c. resistance may be as much as 20 per cent. This section of the country has also the greatest diurnal range of temperature, giving a d.-c. resistance variation of as much as 8 per cent.
INDUCTANCE
The inductance of a circuit formed of two parallel wires whose distance between centers is negligible compared with their length is
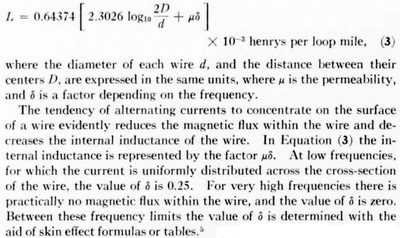 |
For the wire diameters and spacings employed on open-wire lines the change in the total inductance due to skin effect is relatively small.
It is assumed in Equation (3) that the two wires are suspended in space or at a considerable distance from the ground and from other wires. In practise, the presence of other wires probably has some effect on the inductance, but for well transposed lines this effect is negligibly small.
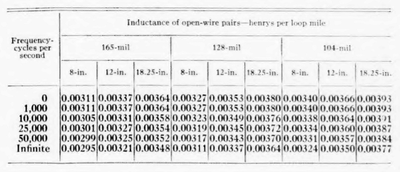
The inductance at different frequencies of 165, 128, and 104-mil copper pairs having various spacings between wires is shown in the following table.
As will be seen from Equation (3), the inductance varies with the logarithm of the separation between wires. In the table the values of inductance are shown for pole pairs, which have a separation between wire centers of about 18.25 inches, and for non-pole pairs having wire separations of 12 and 8 inches. The values of inductance given in the table have been closely checked by measurements on open-wire pairs.
 |
CAPACITANCE
The capacitance of two parallel wires in space with a distance be- tween centers which is negligible compared with their length is
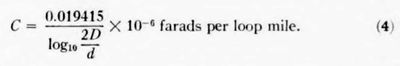 |
It will be noted that the capacitance varies in inverse relation to the separation between wires.
As in Equation (3), it is assumed in this formula that the two wires are suspended in space or at a considerable distance from the ground and from other wires. On an actual line the capacitance of a pair is changed to an appreciable extent by the presence of other wires, and to a slight extent by the capacitance to ground. The true capacitance between the two wires under actual conditions may be derived from the direct capacitances between all wires and the direct capacitances of all wires to ground.(6) The capacitance is not changed to any great ex- tent by skin effect.
The means of insulation and support provided at each pole have an appreciable effect on the capacitance of a pair of wires, especially in wet weather. This is due to the fact that the insulators and, under certain conditions, the pins and parts of the crossarms, act as the dielectric of small condensers which are, in effect, shunted between the line wires. These effects are being discussed in a companion paper.(7) The percentage increase in capacitance due to the insulators varies with different weather conditions and different types of insulators, ranging from about 0.5 to 4 per cent of the capacitance between line wires.
Values of the capacitance of 165-, 128-, and 104-mil pairs in space and on a 40-wire line are given in the following table:
 |
As before, values are given for pairs having wire separations of 8, 12, and 18.25 in. These values include an allowance for the dry weather capacitance of the insulators. The difference between the values in space and on a 40-wire line indicates the importance of the effect of the other wires, the insulators, etc., upon the capacitance. The capacitance values given in the table are fairly representative of the values that will obtain on well transposed lines.
The values of inductance and capacitance which have been given are based on the assumption that the nominal separation between wires is preserved throughout the entire line. This is not the case when drop bracket transpositions are employed. As has been pointed out, the wires are brought closer together at the drop brackets, thereby increasing the capacitance and decreasing the inductance. The amount of the change in inductance and capacitance due to this cause ranges from 1 to 5 per cent for the transposition arrangements designed for carrier system operation.
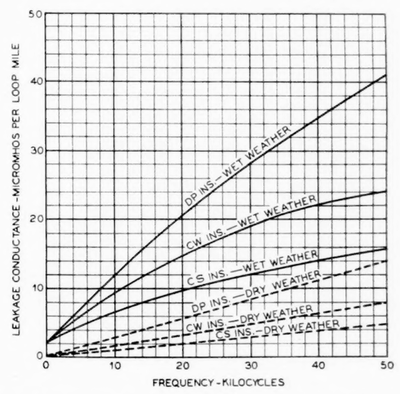
LEAKAGE CONDUCTANCE
The leakage conductance per unit length of circuit, which is represented in the transmission formulas by the symbol G, is by far the most erratic of the primary constants. Since it is a momentous factor in the attenuation its investigation has been very actively prosecuted over a considerable period of time. The determination of the value of G for direct current is quite simple, involving merely a measurement of the actual conductance between wires for a length of circuit short enough to avoid propagation effects. For alternating currents, however, it is customary to employ an equivalent value of G which includes all of the losses suffered by the power transmitted over the pair except the normal I2*R loss in the wires themselves. This inclusion of numerous little-understood losses in the general term leakage has at times served to insulate the individual losses from analysis. Methods of determining the value of the equivalent leakage conductance and of analyzing its component losses are avail- able, however.(8)
 |
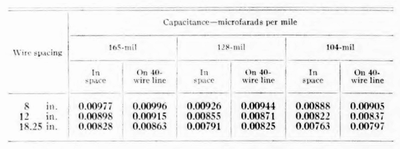
| Fig. 7Types of Insulators Employed in the Bell System. A. Toll Insulator,, B. Dp Insulator,, C. Cw Insulator and Pin Thimble,, D. Cs Insulator. |
The nature and magnitude of the different losses which occur at the insulators are being discussed in detail in a parallel paper. Accordingly, only a brief mention will be made in this paper of the types of insulators which are now in use on the open-wire lines of the Bell System, and of the values of leakage conductance experienced with these different types. The DP or double-petticoat glass insulator illustrated in Fig. 7 is now standard for use on all important toll circuits, except those equipped with the special carrier insulators discussed below. On a number of older circuits single-petticoat glass insulators, known as toll insulators (see Fig. 7) and double-petticoat porcelain insulators are still in place.
 |
| Fig. 8Leakage Conductance of Open-Wire Pairs Equipped With Different Types of Insulators. |
In view of the numerous and complex sources of leakage loss, it is not surprizing [sic] suprising that the leakage conductance for a given pair at a particular frequency varies with changing weather conditions and with the age of the insulators over a very wide range of values. Because of this wide range of variation it is possible to give here only selected leakage values which serve for engineering purposes. Values of the total leakage conductance for open-wire pairs equipped with YP insulators are plotted in Fig. 8. These values are intended to represent the highest values ordinarily obtained on an old circuit which is in a good condition of maintenance. The wet weather values have been so chosen that they should be exceeded on only a few days of the year, while the dry weather values represent the performance that should be expected from any circuit on a clear, dry day.
Particular difficulty is experienced in selecting standard values of d.-c. leakage owing to the fact that the range of values encountered in practise is exceedingly great. The measured values depend to a great extent on the degree to which the line is kept free from tree branches, foliage, moss, broken insulators, and other possible sources of leakage. These special sources of loss, of course, represent a much smaller part of the total leakage losses at carrier frequencies. The standard values of leakage conductance are derived for a line having 40 pairs of insulators per mile. Where the number of insulators differs greatly from this figure, it is necessary to correct the leakage values accordingly. Differences in the number of insulators per mile result from the use of different types and numbers of transpositions, different pole spans, double crossarm construction, etc.
Considerable study has been given to methods of reducing the leak- age conductance, particularly at carrier frequencies, and two new types of insulators have been developed for this purpose. In these there is used an improved dielectric (borosilicate glass) which has a low power factor and a reasonably low dielectric constant, as well as good chemical stability. Two expedients for eliminating losses in the pins and crossarm are employed. In the CW insulators, illustrated in Fig. 7, two metal shells or thimbles are bonded together and placed over the wooden pins. In the CS insulator, also shown in Fig. 7, steel pins are employed and the two steel pins of the pair are bonded together. In the past few years CS insulators have been applied to the open-wire lines of the Bell System in increasingly large numbers. With these two types of insulators a substantial reduction in the total leakage conductance is brought about. The best available figures for the limiting values of leakage conductance for these types are shown in Fig. 8. A further advantage obtained through the application of the new insulators is that of stabilizing the attenuation at carrier frequencies. Experience has indicated that the CS and CI insulators reduce the daily leakage (and attenuation) variations due to change in weather conditions to about one-third and one-half, respectively, of their value for DP insulators. This degree of stabilization is not indicated by the differences between the dry and wet weather leakage values shown in the figure, but it must be recalled that these values represent extreme conditions, while the stabilization referred to above is for average conditions.
ATTENUATION
The attenuation constant is the real part a of the propagation constantly as given in the familiar formula
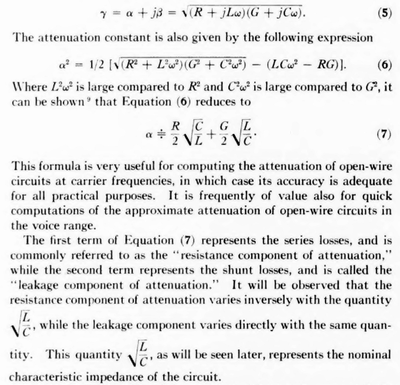 |
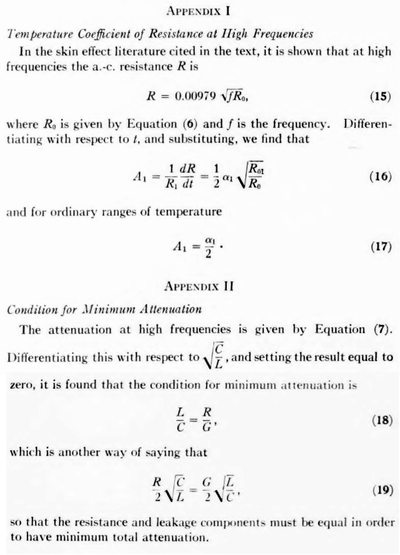
It is shown in Appendix II that a circuit of fixed resistance and leakage conductance will have minimum attenuation when the ratio of L to C is such as to make the resistance component equal to the leakage component. Because of the variation of the resistance and leakage conductance with frequency, the ratio of L to C which gives minimum attenuation evidently depends upon the frequency. At voice frequencies the resistance component for open-wire circuits is, as a rule, considerably larger than the leakage component, so that it is generally possible to reduce the voice-frequency attenuation by inserting loading coils, which increase the value of L and thus reduce the resistance component at the expense of an increase in the leakage component. The amount of reduction in attenuation obtainable by loading is evidently limited by the value of the leakage component and by the additional resistance which is contributed by the loading coils. For open-wire circuits at carrier frequencies the value of the leakage component of attenuation is quite large in comparison with the resistance component, and coil loading would, in general, be detrimental. At the present time the use of loading on the open-wire circuits of the Bell System has been practically abandoned. Owing to the importance of other factors, especially the line crosstalk, it is ordinarily impracticable to design the open-wire circuits to secure precisely the minimum attenuation at the highest working frequency. In the carrier frequency range, however, the wet weather attenuation of the pairs most commonly used is not materially higher than the theoretical minimum.
 |
| Fig. 9Voice-Frequency Attenuation of Open-Wire Pairs Equipped With Dp Insulators. |
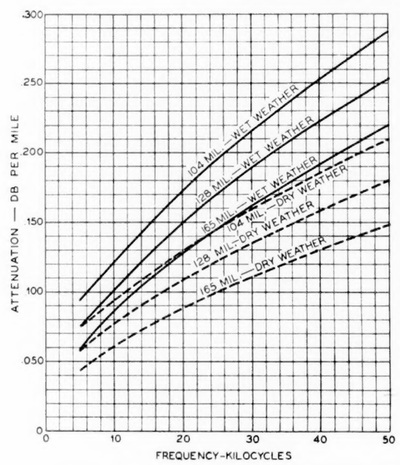 |
| Fig. 10Carrier Frequency Attenuation of Open-Wire Pairs Equipped With Dp Insulators. |
Values of the attenuation constant of open-wire pairs of different gages when equipped with YP insulators are presented in Figs. 9 and 10. The values are plotted in db per mile.(10)
The attenuation values of Figs. 9 and 10 have been determined for a temperature of 20 deg. cent. (68 deg. fahr.) and for the dry and wet often taken of this fact by making the repeater spans longer than normal.
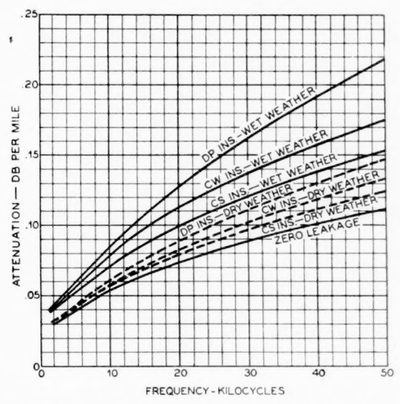 |
| Fig. 11Attenuation of 165-Mil Open-Wire Pair for Various Conditions of Insulation. |
A comparison of the attenuation values for a 165-mil open-wire pair when equipped with different types of insulators is presented in Fig. 11. For purposes of comparison with the normal values a curve of the attenuation due to resistance only, representing the ideal condition of zero leakage conductance, also is given in Fig. 11.
The values of line capacitance employed in determining the attenuation of values of Figs. 9, 10, and 11 include an allowance for the average capacitance increase due to the insulators. The attenuation curves shown are strictly applicable to pairs having a wire separation of 12 in., but they are approximately correct for spacings of 8 and 18.25 in. When the number of pairs of insulators per mile differs greatly from the standard value of 40, a correction is applied to the attenuation values. Special curves make it possible to obtain this correction conveniently. Curves are also available for correcting the standard attenuation values to take care of changes in temperature.
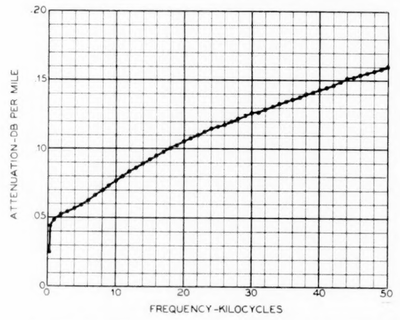 |
| Fig. 12--Attenuation Measured on A Well-Transposed 128-Mil Open-Wire Pair With 8-Inch Spacing. |
It should be understood that the attenuation of an open-wire pair varies from time to time over a wide range of values, and therefore it is not to be expected that the values of attenuation measured at any particular time will necessarily coincide with the theoretical values. It should also be understood that the attenuation measured on an actual pair never bears the perfectly smooth relation to frequency which is shown on the standard attenuation curves, but exhibits irregularities varying in magnitude according to the irregularities existing on the line. Thus the curve of attenuation as measured on a very well transposed open-wire pair,(11) which is delineated in Fig. 12, represents about as smooth an attenuation curve as it is possible to obtain on an open-wire circuit. The attenuation values shown on this curve are somewhat lower than the standard values for similar pairs. This is doubtless explained by the fact that the insulators on this particular pair were new, and the further fact that the measurements were made in winter when the temperature was low.
An illustration of the significance of the attenuation data given above may be of interest. One of the longest carrier telephone systems now in service extends from Davenport, Iowa to Sacramento, California, a total distance of about 2100 miles. 749 The highest frequency employed in this system is approximately 28,000 cycles. Using the attenuation values for a 165-mil pair at 28,000 cycles, it appears that the dry weather attenuation for the entire length of this system might be approximately 220 db or less, and the wet weather attenuation about 330 db. This means that without amplification along the line the ratio of the transmitted power to the received power might vary from 10x22 to 10x33 Since the attenuation of a repeater section is ordinarily limited to from 25 to 40 db, ten repeaters are employed to span the total distance, and in order to compensate for the attenuation variations a gain regulating mechanism known as a pilot channel must be used.
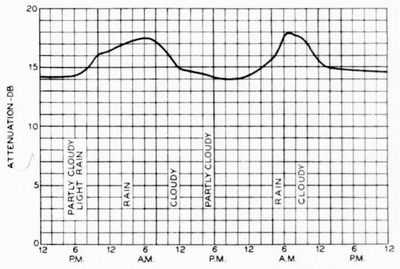 |
| Fig. 13Measured Variations in the Attenuation of An Open-Wire Pair. |
In the preceding illustration it was assumed that the range of variation in attenuation increases in direct proportion to the length of the circuit. Although this may theoretically be possible, it has been found in practise that the attenuation variations during any given period of time increase less rapidly than the circuit length. The reason for this is that augmenting the length of the circuit obviously reduces the likelihood of experiencing extreme wet weather conditions simultaneously over the entire line. A practical example of how the open-wire attenuation varies from time to time is afforded by Fig. 13, which shows the measured attenuation changes on a line 110 miles long during the period of two light rainstorms.
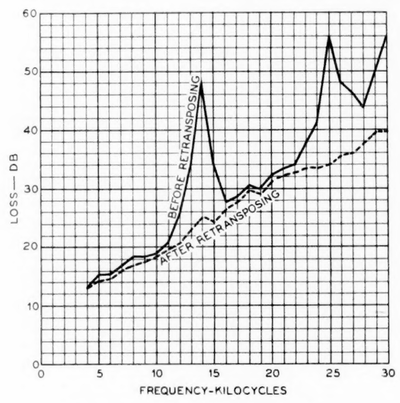 |
| Fig. 14Absorption Peaks on An Open-Wire Pair. |
One further point is of interest in connection with the subject of open-wire attenuation. Inductive or conductive coupling between a pair and the other circuits on the line may result in the absorption of energy in these circuits. Fortunately, the losses due to this cause are small on well transposed lines. On inadequately transposed lines, however, this interaction with other circuits, in addition to producing small losses over a wide range of frequencies, may cause incredibly large losses over a narrow band of frequencies, producing what is known as an absorption peak in the attenuation curve. This interesting phenomenon is illustrated in the attenuation curves of Fig. 14, which show how two very pronounced absorption peaks on a line about 300 miles in length were smoothed out by the application of improved transpositions. The magnitude of one of these absorption peaks will be appreciated when it is realized that the received power at the peak frequency is about one two-hundredth of that at the adjacent frequencies.
IMPEDANCE:
The characteristic impedance is defined by the well-known formula:
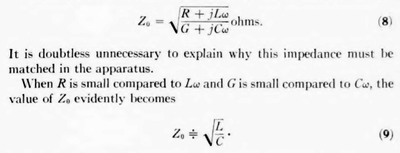 |
This is known as the nominal characteristic impedance. noted that this impedance is a pure resistance. It will be In the carrier range the actual impedance of an open-wire pair is substantially equal to the nominal characteristic impedance.
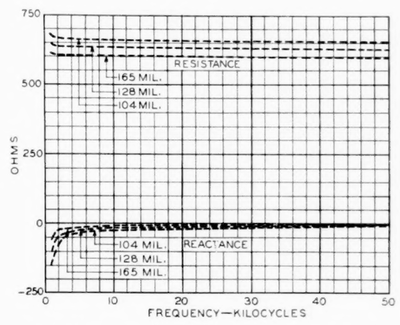 |
| Fig. 15Carrier-Frequency Impedance of 12-In. Open-Wire Pairs. |
Values of the characteristic impedance in dry weather of open-wire pairs with 12-inch wire spacing are presented in Fig. 15. These values have been derived from the standard values of inductance, capacitance, and leakage conductance and from resistance values at 20 deg. cent. The basis for the impedance value of 600 ohms resistance, which has become almost a tradition in so many phases of telephone work, will be obvious from Fig.15. The impedance curves for pairs with 8-inch and 18.25-inch spacing are similar to those of Fig. 15, the resistance values for these spacings being about 45 ohms lower, and 40 ohms higher, respectively, than the values shown for 12-inch spacing.
Changes of resistance and leakage conductance due to changing weather conditions have very little effect on the characteristic impedance at frequencies above 1000 cycles. Changes of insulator capacitance due to changing weather conditions or the use of different numbers or types of insulators have an appreciable effect on the impedance. Deviations from the normal spacings between wires which result from the use of drop bracket transpositions also have an important effect upon the impedance.
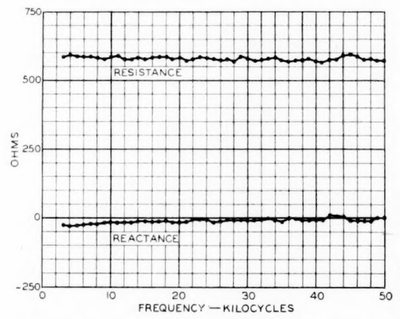 |
| Fig. 16Impedance Measured on A Well-Transposed 128-Mil Open-Wire Pair With 8-In. Spacing. |
Like the measured attenuation, the impedance which is measured for an open-wire pair is affected by the presence of line irregularities. Hence, the measured impedance is never a smooth function of frequency, but displays slight irregularities throughout the entire range. This is apparent from Fig. 16, which gives a curve of the impedance measured on a well transposed pair. This curve is in remarkably close accord with the generalized values of impedance, the maximum deviation from the theoretical curve being about 2 per cent.
Like the attenuation, the impedance of an open-wire circuit in a narrow band of frequencies may be radically changed by interaction with adjacent circuits. These large irregularities in the impedance commonly accompany absorption peaks in the attenuation, and are, of course, due to the inadequacy of the line transpositions.
PHASE CHANGE AND VELOCITY OF PROPAGATION
The imaginary component of 6 of the propagation constant is known as the phase constant because it indicates the change in the phase of the voltage and current in circular radians per unit length of line. The value of the phase constant is given by
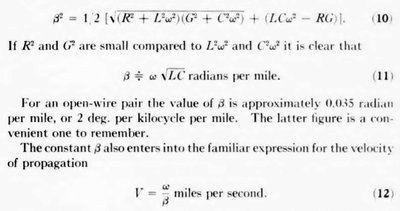 |
The velocity of propagation on open-wire lines approaches the velocity of light, which is 186,000 miles per second. The velocity is reduced below this value by the increase of capacity due to the presence of the other wires and the insulators, by the internal inductance, and by the presence of resistance and leakage conductance. Values of the velocity of transmission for open-wire pairs are presented in Fig. 17. At frequencies above a few hundred cycles the velocity of transmission is, apart from the effect of line irregularities, practically constant through- out the frequency range.
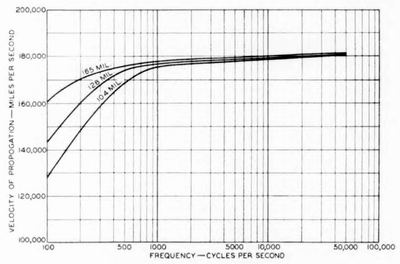 |
| Fig. 17Velocity of Propagation for Open-Wire Pairs. |
In the last few years increasing attention has been focused upon the phase characteristic of the open-wire circuit. One of the reasons for this is that different velocities of transmission for different frequency components in a signaling band (which are obtained when the phase shift of the circuit is not a linear function of the frequency) may give rise to what is known as phase distortion, and it may be necessary to correct this distortion by suitable networks.(12)(13)
CHARACTERISTICS OF PHANTOM CIRCUITS
Phantom circuits, which are derived from two pairs or side circuits by transmitting over the wires of one pair in parallel and using the wires of the other pair in parallel as a return, have been employed in the telephone plant for voice-frequency transmission for a number of years. Their use for carrier transmission is limited chiefly by the difficulty of reducing the cross induction with other circuits at high frequencies.
Phantom circuits are generally derived either from horizontally adjacent non-pole pairs or from vertically adjacent pole pairs. Thus wires 1 and 2 are phantomed with wires 3 and 4, wires 5 and 6 with wires 15 and 16, etc. In some of the newer transposition arrangements the non-pole pairs are not phantomed, since it has been found that the omission of the phantom permits the operation of a larger number of carrier systems on one line without excessive mutual interference.
The resistance of a phantom circuit is evidently half of the corresponding value for the side circuit.
If the two wires forming one of the sides of the phantom circuit are designated 1 and 2, and the wires forming the other side are designated 3 and 4, the inductance of the phantom circuit is
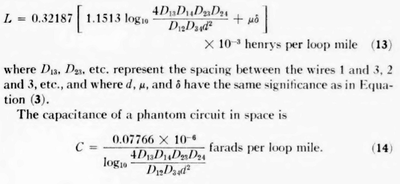 |
Equations (13) and (14) are based on the assumption that the phantom circuit is sufficiently well transposed to secure balanced voltages, cur- rents, and charges on the four wires. The capacitance of the phantom circuit is, of course, affected by the capacitances of its component wires to the other wires of the lead and to ground and also by the capacitances of the insulators.
The losses which contribute to the leakage conductance of phantom circuits are similar to those which have been discussed for side circuits. The ratio of the phantom circuit leakage conductance to that of the side circuit will losses depend upon the relative magnitudes of these different Varying relations between the different types of losses give a ratio of phantom circuit leakage conductance to side circuit leakage conductance which might conceivably range between the extremes of land 6. For practical engineering purposes, however, the leakage conductance of the phantom circuit is generally assumed to be twice that of the side circuit.
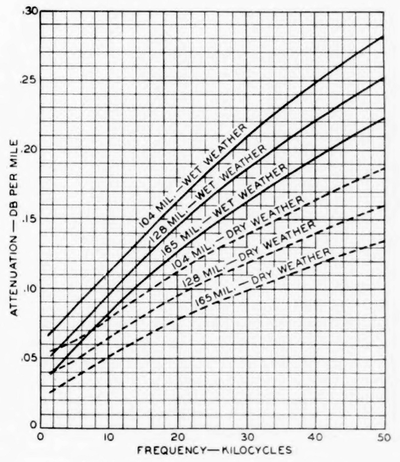 |
| Fig. 18--Attenuation of Phantom Open-Wire Circuits. |
Curves of the attenuation of non-pole pair 12-inch phantom circuits of different gages are depicted in Fig. 18. In most cases the attenuation of the phantom circuit is somewhat less than that of the corresponding side circuit. Frequently, however, the advantage of lower attenuation is under practical conditions more than offset by the large noise and crosstalk effects experienced on the phantom circuits.
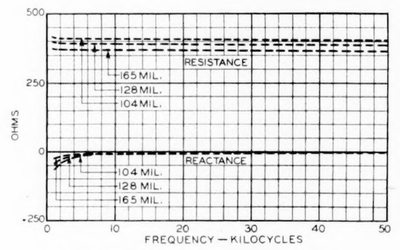 |
| Fig. 19Impedance of Phantom Open-Wire Circuits. |
Values of the dry weather impedance of 12-inch phantom circuits are presented in Fig. 19. It will be observed that the impedance of a phantom circuit averages about 60 per cent of the impedance of a 12- inch side circuit.
CHARACTERISTICS OF TRON-WIRE CIRCUITS
There now exists on the toll lines of the Bell System a small amount of galvanized iron or steel wire. Nos. 12 and 14 B. W. G., with diameters of 109 and 83 mils, respectively, are the gages most commonly found. Steel wire and BB iron wire are both used, the latter being of more frequent occurrence. These iron-wire pairs display such large values of modulation and high-frequency attenuation that they are generally quite unsuitable for carrier transmission.
The skin effect resistance of iron wire may be computed by standard theory, provided that the values of the resistivity φ and permeability µ ware known. The values of φ for BB iron and steel wire are about 12.8 and 14.8 microhm-centimeters respectively. 50 It will be noted that these values are about seven and eight times the resistivity of copper. For currents of telephonic magnitude at frequencies from about 500 to 50,000 cycles, it has been found that the value of the permeability µ of iron wire of the above sizes ranges from about 110 to 50. Study of the available data indicates that the best average value of µ at 1000 cycles is about 85 and that the effective value decreases with increasing frequency. Because of the high d.-c. resistance and the large skin effect ratio which results from the high permeability, the resistance of iron wire for alternating currents is extremely great.
Except at low frequencies, where the internal inductance of the iron wire is large, the total inductance of an iron-wire circuit is not far different from that of the corresponding copper circuit. mental results. The capacitance and leakage conductance of iron-wire circuits are substantially the same as for similar pairs of copper wire.
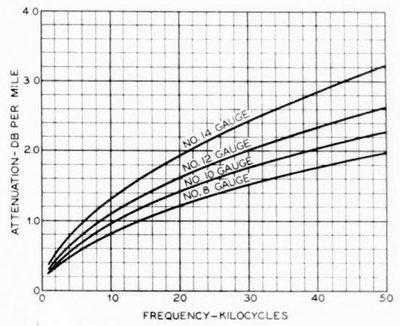 |
| Fig. 20Attenuation of Iron-Wire Circuits. |
Typical attenuation curves for several gages of BB iron wire in dry weather are shown in Fig. 20. These curves are based upon experimental results. It will be noted that the attenuation of an iron-wire circuit averages about ten times that of the corresponding copper-wire circuit. It should be understood that the attenuation values for an iron-wire circuit are subject to rather wide variations in practise, particularly because of the effects of corrosion. There is some change in the attenuation of an iron-wire circuit with change in weather conditions, but this is a relatively small percentage. The impedance of an iron- wire circuit has the same order of magnitude as the impedance of a similar copper-wire circuit.
 |
(1) Presented at the Summer Convention of the A. I. E. E., Toronto, Ont., Canada, June 23-27, 1930.
(2) See Carrier Systems on Long Distance Telephone Lines, by H. A. Affel, C. S. Demarest, and C. W. Green, A.I. E. E. Trans., Vol. 47, 1928, pp. 1360-1386. Bell System Tech. Jl., July 1928, pp. 564-629.
(3) See Wave Propagation Over Parallel WiresThe Proximity Effect, J. R. Carson, Phil. Mag., Vol. 41, April 1921, pp. 607-633; Experimental Researches on Skin Effect in Conductors, A. E. Kennelly, F. A. Laws, and P. H. Pierce, A. I. E. E. Trans., Vol. 34, Part 2, 1915, pp. 1953-2021, and Skin Effect Resistance Measurements of Conductors at Radio Frequencies, A. E. Kennelly and H. A. Affel, A. R. E. Proc., Vol. 4, No. 6, Dec. 1916, pp. 523-574.
(4) The value of R, and also that of the other primary constants, may be determined directly from open and short-circuit impedance measurements on a line short enough to avoid propagation effects. A longer line may be used instead, in which case it is necessary to correct for such effects.
(5) See, for example, Circular No. 74 of the Bureau of Standards, Radio Instruments and Measurements.
(6) See Technical Report No. 54 of the Railroad Commission of the State of California, Joint Committee on Inductive Interference, entitled Inductive Interference Between Electric Power and Communication Circuits, 1919.
(7) See A Study of Telephone Line Insulators, by L. T. Wilson, printed in this issue of the Bell System Technical Journal.
(8) See Methods of Measuring the Insulation of Telephone Lines at High Frequencies, by E. I. Green, A. J. E. E. Trans., Vol. 46, 1927, pp. 514-519.
(9) See Transmission Circuits for Telephonic Communication, by K. S. Johnson, N. Y., Van Nostrand, 1927.
(10) See DecibelThe Name for the Transmission Unit, by W. H. Martin, Bell System Tech. Jl., January 1929, pp. 1-2.
(11) Methods of measuring the attenuation, impedance, and crosstalk are discussed in High-Frequency Measurements of Communication Lines, by H, A. Affel and J. T. O'Leary, A. I. E. E. Trans., Vol. 46, 1927, pp. 504-513.
(12) See Distortion Correction in Electrical Circuits with Constant Resistance Recurrent Networks, by O. J. Zobel, Bell System Tech. J1., July, 1928, pp. 438-534.
(13) See Wire Transmission System for Television, by D. K. Gannett and E. I. Green, A. I. E. E. Trans., Vol. 46, 1927, pp. 946-953 (Bell System Tech. Jl., October, 1927, pp. 616-632).
