[Trade Journal]
Publication: Western Electrician
Chicago, IL, United States
vol. 23, no. 23, p. 310-311, col. 1-3,1-2
High-voltage Power Transmission.
BY CHAS. F. SCOTT.
PART II
Some measurements upon the line were made by determining the power to the raising transformers when the lines were connected and when they were disconnected. These measurements showed that the loss due to the line is small below 43,000 volts, but increases rapidly when about 50,000 volts is exceeded, and reached 16.4 kilowatts at 59,000 volts. The results up to 52,000 volts are given in curve 2, Fig. 9. Curve 1 in this figure is the loss on the same circuit, measured a year later by a different observer, using a different method. At the maximum loss shown there is a difference of only eight or nine per cent. in electromotive force for the same loss on .the two curves.
 |
| Fig. 6. High-Voltage Power Transmission. |
The record of the operation of this line at 50,000 volts for over a month is of very great interest, as it is a practical demonstration of the feasibility of operating a line at 50,000 volts, a pressure four or five times as great as any which had been in general commercial use. Mr. V. G. Converse had been up to this time closely associated with this work. He had much to do with the design and construction of the high-tension transformers and insulators, tests upon losses in lines made at the Pittsburg laboratory and the tests at Telluride.
MEASUREMENTS AT TELLURIDE.
The work at Telluride was then taken up by R. D. Mershon. The facilities for experimental work were increased and instruments were provided for carrying on the tests. Mr. Mershon found peculiar difficulties in making exact measurements of the power to the circuit. A wattmeter in the low-tension circuit of the raising transformer led to errors under the conditions which prevailed. Some very able and painstaking work was displayed in detecting the error and overcoming it with the facilities at hand — and the facilities were none too plenty in the heart of the Rocky Mountains for making measurements which would tax the resources of almost any laboratory. The apparatus used introduced a disturbing influence in the circuit, which, however, could be measured and eliminated. On the other hand, a wattmeter for measuring power on a high-tension circuit must accommodate a very high voltage and a very small current. As the charging current to an open line is usually, very large in proportion to.the loss current, the error of the instrument is very sensitive to slight variations of phase in the shunt current. A description of the instruments and the methods used are given in an extract from the report of Mr. Mershon, which will be found at the end of this paper in Appendix A. The results of the measurements and the conclusions are given partly by extracts from Mr. Mershon's report and partly in abstract.
RESULTS OF MEASUREMENTS.
The results of measurements taken are embodied in curves.
In every case the measurements were taken upon an open-circuited line — in no case upon a line which was transmitting power.
The line losses obtained are, therefore, a combination of those occurring between the line wires and the very small I 2 R loss in the wire itself due to the charging current of the line.
Measurements taken with the Weston wattmeter include the loss in the high-tension coil of the power transformer due to the currents applied to the line. This loss is in general small and in the following curves corrections have not been made tor it. Curves taken with the Thomson wattmeter require no-such correction.
There is an additional correction which may be made in the case of those curves whose voltages were obtained from the raising transformer. This correction arises from the fact that the action of the capacity current taken by the line in connection with the series reactance of the transformer supplying it is such as to make the voltage impressed upon the line somewhat greater than that obtained by the ratio of the transformer winding. The measurements taken to determine the amount of the error in voltage show it to be small.
There were two generators used. One was that regularly running and supplying power to the power circuits of the Telluride Power Transmission company. It is a 600-kilowatt, 22-pole, quarter-phase machine, delivering 500 volts at a frequency of 60, or 7,200 alternations per minute. Its armature is of the slotted type and is wound with copper bars. In the notes this generator is designated as "slotted armature."
The other generator is one whose field is that of the 100 kilowatt toothed armature machine, originally sent out as a part of the first Gold King transmission plant. It has twelve poles and as originally run operated at 3,000 volts and 10,000 alternations. There are two armatures for this machine; a surface wound armature, designated as "smooth armature," and a toothed armature, designated as "toothed armature."
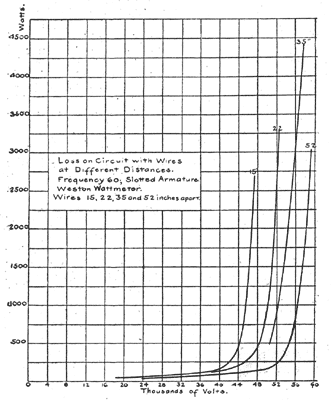
Comparison between Insulators. — A set of measurements was made for comparing the loss on the three circuits supplied respectively with large glass, small glass and porcelain insulators. The curves are very nearly identical and correspond very closely with the right-hand curve in Fig. 6.
There was a heavy, wet snow on the ground and the cross-arms at the generating station and more or less snow all along the line; that at the further end being drier than at the generating station. There was more or less snow falling during the measurements, and this accounts for a wide variation of the points taken at the high voltages, as falling snow renders the wattmeter reading very unsteady, the unsteadiness being such as one might expect it from time to time there was a discharge between the wires. This unsteadiness does not seem to be as great in the case of falling rain as in the case of falling snow.
Loss and Distance between Wires. — A series of measurements was made to determine the connection between the loss and the distance between wires.
As at that time it had not been fully demonstrated that the loss was not affected by weather conditions except there was precipitation, changes ill distance between wires were made upon one circuit, while the distance between wires on another circuit was maintained always the same, and the latter was used as a reference circuit when a change in loss was obdinate.
The several curves have been plotted together, due correction being made for the slight difference in the loss in the reference circuit, which probably resulted from slight differences in the precipitation when the curves were taken. The distance between the wires in the several tests was 15, 22, 35 and 52 inches respectively. The results are shown in Fig. 6. It will be noted that the loss is much greater when the wires are close together and that the curve begins to ascend at a lower voltage.
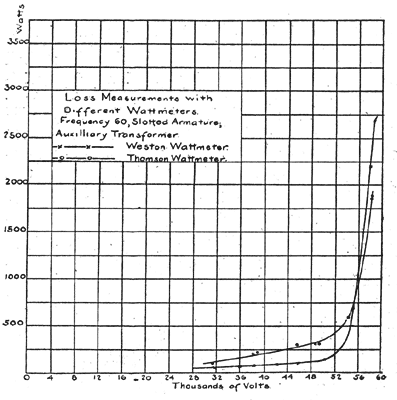
Comparison of Wattmeters. — The loss curves in Fig. 7 were taken on one of the circuits, first, with the Weston wattmeter and then with the Thomson wattmeter. The Weston wattmeter was not in circuit when the measurements with the Thomson wattmeter were taken. As an additional check, the readings were taken on each of the wattmeters of the loss occurring in the shunt resistance; of the Thomson wattmeter the results were in practical agreement with each other and with those obtained by calculation. The discrepancy in the results obtained on the two instruments when measuring line loss will be referred to later.
Loss on Insulators. — A set of comparative readings was taken on one of the circuits and on a dummy circuit identical with the main circuit, as regards kind and number of insulators and the size of wire, but only 60 instead of 11,720 feet in length. The results show that the loss on the two circuits is practically identical up to about 50,000 volts, which is the part of the curve below the bend. The losses agree closely with those shown in Fig. 6. At higher voltages the loss on the dummy circuit increased slightly, indicating that the loss was of the same nature as that at a lower voltage. The agreement of the loss on the two lines at low voltage (i. e., below the bend in the loss curve) indicates that this loss was over the insulators. The great increase in loss on the long line at high voltage indicates that the loss was due, not to the insulator, but to the line.
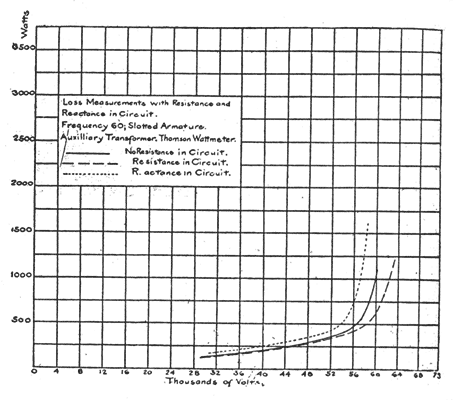
Resistance and Reactance in the Circuit. — Measurements were made with resistances between the generator and the raising transformer, then with reactance and then with neither resistance nor reactance. The results are shown in Fig. 8, and indicate a different condition, depending upon the character of the circuit supplying the current. It was presumed that this difference arose from a modification of wave form of the electromotive force applied to the line.
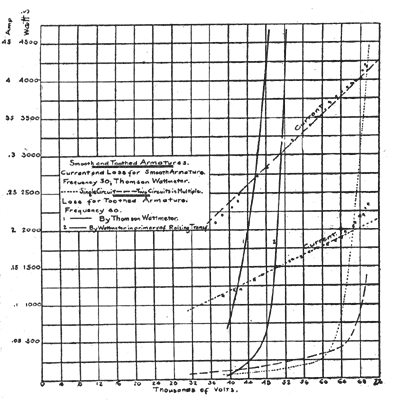
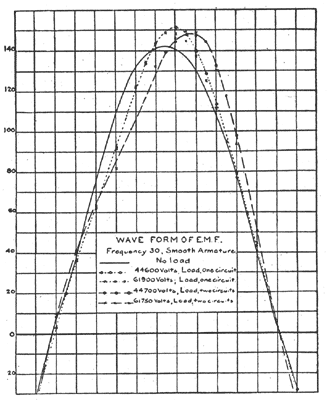
Wave Form and Loss. — Measurements were made upon the wave form and the corresponding losses when different generators were used and different circuits were connected. In one test an armature giving nearly a sine wave was used which delivered current at 30 cycles. Measurements were made upon one circuit only, and then upon two circuits in multiple. The current and the loss are both given in Fig. 9. The wave form for no load and for both conditions of load are given in Fig. 10. The current taken by the two circuits in multiple-is twice that to a single circuit. The variation from a straight line in one of the current curves is due to a change in wave form as the voltage is increased. The loss for the two circuits in multiple is about twice as great as for one circuit at low voltages, but it is less than that for one circuit at high voltages. Referring now to the wave form taken at high voltage, it is seen that the wave form for the two circuits in multiple has a lower maximum than that for one circuit alone. The reduced loss on the two circuits is undoubtedly due to the different wave form when both circuits were connected. The distortion of the wave form is due to the reaction which, the leading current produces in the generator and transforming apparatus.
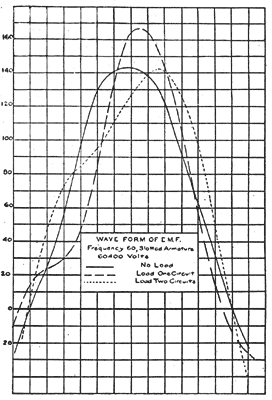
Wave forms were also taken on the slotted armature giving 60 cycles. The wave forms are given in Fig. 11. The conditions are similar to those just described, in that a-single circuit produces a wave having a much higher maximum than that produced when two circuits are run in multiple. The losses (which are not shown) bear the same general relation as that in the last case, namely, the loss with two circuits is greater at lo voltage and at the high voltage is less than on a single circuit.
 |
| Fig. 7. High-Voltage Power Transmission. |
A wave form was taken upon the toothed armature, both at no load and also when supplying current to one of the circuits. These are shown on Fig. 1-2. This wave differs radically from a sine wave at no load and is greatly distorted when supplying a leading current. In the no-load wave the value of the fundamental is 72.5 per cent.; the third harmonic 21.6 per cent; the fifth harmonic 4.8 per cent. The corresponding loss is given in curve 1, Fig. 9. The distorted wave makes the Thomson wattmeter read too high, especially at the lower electromotive forces.
OTHER OBSERVATIONS AND TESTS.
A series of observations was taken extending over a period of 33 days, to determine whether there was any connection between the loss occurring on the lines and the variations in weather conditions. Three readings were taken each day. They were, in addition to the wattmeter readings, readings for barometric pressure, temperature, humidity, wind direction and wind velocity. The weather observations were taken simultaneously at Ames and the King, using sets of weather instruments furnished by the United States Weather Bureau. The range of these observations is shown in a table given below, in which maximum and minimum refer to the maximum and minimum results obtained at any time during the 33 days over which the measurements extended:
 |
If there was any variation in the loss on the lines for this range of weather conditions, it was so small as to be appreciable. The results of all measurements taken during this work seem to confirm the fact that the only weather condition whatsoever which affects the loss to any practical extent is that of precipitation. The loss seems to bear some relation to the size of the particles precipitated, being greater for a fall of snow in which the flakes are large than one in which the flakes are small.
 |
| Fig. 8. High-Voltage Power Transmission. |
In the power transformers used, the series reactance was comparatively small because of the subdivision of the coils. A chanee in the condition on the line as regards loss occurred when the Weston wattmeter was placed in circuit. This was detected by measurement upon the Thomson wattmeter, both when the Weston wattmeter was in circuit and when it was not. Moreover, the lines hissed when the voltage is 55,500 and the Western wattmeter is out of circuit, but when the Weston wattmeter is thrown into circuit the hissing ceases, although the voltage rises to 57,700. The hissing sound is a characteristic of high voltage lines and begins at the bend in the loss curves. It always accompanies luminosity of the lines.
Along with this change there was another phenomenon not previously mentioned. This was a discharge which took place from time to time between the terminals of individual choke coils. The discharge would occur sometimes between the terminals of one choke-coil and sometimes simultaneously on two or three of the choke-coils. These discharges made considerable noise, sounding very much like a pistol shot, and could be heard at a considerable distance from the transformer house. As the choke-coil terminals are distant from each other about 8 1/4", it is not thought that this discharge took place through the air, but over the surface of the wood enclosing the choke-coil. The discharge, however, left no mark on this surface. Simultaneous with these choke-coil discharges one could hear, it standing under the line some little distance from the transformer house, a slight snap which seemed to be a phenomenon rather of the whole line than of any particular spot in it. Sometimes there was a corresponding snap over the lightning arresters. As the lightning arresters make more or less noise at all voltages, this snap over them may have been present at all times but in some cases not sufficiently well marked to be heard above the continued hissing of the lightning arresters.
After the preceding results had been obtained, the two power transformers were connected up with their high-tension windings in series, the point of connection between them being grounded, and with their low-tension windings in multiple. With this arrangement voltage was impressed on one of the circuits, power being supplied by the smooth armature at 7,200 alternations. The voltage was run by means of the machine field to 90,000.
As the power taken by the lines at this voltage overloaded the motor used to drive the generater, a span was cut out of the circuits at a little distance from the station, leaving about 500 feet of wire in them. The voltage was ran up to 133,000 volts and held there for some minutes; but the current finally jumped from the outside terminal of each transformer to the iron, smashing the heavy glass tube with which these terminals were insulated.
DISCUSSION OF RESULTS.
The following is taken from Mr. Mershon's discussion of the results of his tests:
There is evidently a certain critical voltage at which the loss occurring between wires begins to increase very rapidly; indeed, it seems as though there might be something of the nature of a polarization similar to that which occurs in the case of an electrolyte; that there is something of this nature in the case of air or other gases subjected to an electrostatic stress is well known, and it has been taken as an explanation of the fact, that in the experimental determination of sparking distances in air, a certain minimum potential is necessary to establish an arc, no matter how small be the sparking distance. Also, Varley has done some work on tubes containing gases. This work was done with a series of Daniell's cells yielding 300 to 400 volts. The voltage was impressed upon electrodes sealed into the tubes. He established the following facts: First, that each tube required a certain potential to leap across; second, that the passage for the current having been once established a lower potential was sufficient to continue the current; third, if the minimum potential which would maintain a current through the tube be P and the voltage varied to P plus 1, P plus 2, etc., to P plus N, the current will vary in strength as 1, 2, 3, etc., N; P always meaning the lowest value at which the current will continue, and is less than that at which the current starts.
If such a condition of affairs obtains in this case, the loss curves of the preceding sheets must be made up in two parts, one the loss over the insulators and cross-arms, the other the loss occurring through the air. The first part of the loss curve up to or near the point where the abrupt bend begins must be the loss over the insulators and cross-arms alone; beyond the point where such a bending occurs, the loss curve must be made up of a combination of the two losses referred to.
If the action which takes place in air is similar to that obtained by Varley, we might expect that both (1) the position of the critical bend on the loss curve and (2) the law which the loss follows above the bend would be affected by the form of the electromotive-force wave impressed upon the line, for the former (1) must depend, not upon the mean square of the voltage impressed upon the line, but upon the mean square of that portion of the electromotive-force wave which is above a certain critical voltage, and the latter (2) must depend upon the form of that portion of the electromotive-force wave above a certain critical voltage, because, as Varley shows, the minimum voltage at which this peculiar loss begins differs slightly from the minimum voltage at which it will continue after the action has been established. If it were not for the latter consideration it would be comparatively easy to determine the equation for such loss, at least in the case of a pure sine wave, and it might be that there is a sufficiently small difference between the voltage at which this loss will begin and the voltage at which it will discontinue for such an equation to hold practically. That the loss depends upon the maximum value, if not upon the form of the electromotive-force wave, is shown by several of the loss curves in connection with their corresponding wave forms. This is particularly noticeable in one or two cases where the loss on two lines in multiple is less than that on one line, and although some of these comparisons will have to be made between curves taken on the two different wattmeters and are, therefore, not strictly comparable, they may be compared after such correction as is mentioned below in discussing the wattmeters. In any case the curves are comparable, qualitatively, as regards the position of the critical point.
 |
| Fig. 9. High-Voltage Power Transmission. |
It might be objected that the results are rendered questionable by the curves in Fig. 7. The curves were taken under presumably similar conditions, except that one was obtained by means of the Thomson wattmeter and the other by means of the Weston wattmeter. This discrepancy is attributed to a charging current passing through the shunt resistance of the Thomson wattmeter. That the amount of capacity current necessary to produce the discrepancy is small appears upon the following considerations: In one case the loss obtained upon a circuit at 38,000 volts when using the Weston wattmeter is 90 watts, and under the same conditions, but using the Thomson wattmeter the loss is 215 watts. The difference in the loss obtained by the two wattmeters is, therefore, 125 watts. The current is about 0.25 of an ampere. Now, 0.25 of an ampere, if in step with the electromotive force, would give on the Thomson wattmeter at 38,000 volts a reading of 9,500 watts; therefore the capacity current through the shunt resistance necessary to produce the discrepancy of 125 watts is 125 divided by 9,500, or about 1.3 per cent. of the current in the shunt resistance. The shunt resistance has a value of 1,202,300 ohms; at 38,000 volts the current through it would be about 0.032 amperes; 1.3 per cent. of this, or 0.00416 amperes, is that required to produce the discrepancy noted. In further support of this method of accounting for the discrepancy, the results obtained at different numbers of alternations, using the Thomson wattmeter, show a variation for different numbers of alternations of the losses below the bend in the loss curve, and which are thought to occur over insulators and cross-arms. There should be no variation in such loss for a variation in frequency.
Any discrepancy occurring in the Thomson wattmeter by reason of a capacity current in its shunt resistance will be affected to a greater or less extent by change in the wave form.
It is believed that all the phenomena connected with this work may be studied in a tube which has been partly exhausted. The work could then be done with comparatively low voltage and using direct current, which would much simplify the measurements. The contents of the tube might be partially rarefied air or other gas, as the action would undoubtedly be similar in all gases. With such a tube might be studied the law of variation in distance and form of electrodes, also in material and surface of the same.
RESUME AND CONCLUSIONS.
It is undoubtedly true that the loss is made up of a loss over insulators and a loss between wires, and that the latter is the only loss worth considering.
The loss between wires is not affected by any atmospheric conditions except precipitation. This statement, of course, must be taken as applying to such a climate as that in which the measurements were taken. The lines were seldom in fogs or clouds, and when they were, or when rain was falling, the moisture was of the purest. Near cities the loss would be undoubtedly much greater than that shown in these curves, because of the impurities both in solution in the moisture of the atmosphere and in suspension.
There will be for a given transmission a certain economical voltage, because while an increased voltage, with a given line wire, will reduce the loss in this wire by decreasing the transmission current, it will also increase the loss between the wires.
It is believed that attention to wave form is very important. The sine wave is undoubtedly the best as giving a stable form, and because of superior results with all kinds of apparatus. A flat wave would, of course, give less loss, but would not be stable, and as the nearest practical approach to a sine wave will not be perfectly stable but will still contain some harmonics, it will be of advantage to keep the series reactance of the transformers and generators as low as possible.
It is believed that 40,000 volts is perfectly conservative and safe as regards loss between wires for any ordinarily good wave form, and in a climate such as that in which the measurements were taken, i.e., where the air and precipitated moisture are practically pure, 40,000 volts conies well below the bend in the loss curve even under the worst weather conditions.
 |
| Fig. 10. High-Voltage Power Transmission. |
I can see no advantage of porcelain over glass, unless it be that of superior mechanical strength. The latter is rather a doubtful advantage. The ball from a heavy caliber rifle or revolvers such as are used in the western country will smash any insulator, whether glass or porcelain. Porcelain offers a more tempting mark, being white. As to hygroscopic properties; no difference could be discovered so far as these measurements were concerned. It will make little difference under running conditions whether the insulator be hygroscopic or not, as the small amount of power necessary to keep the surfaces dry will be insignificant. I say under running conditions, because in starting up a "cold" line there is danger of breakdown if current is put on suddenly at full value, instead of being raised gradually. As far as the resistance to piercing is concerned, glass is just as good, practically at least, as porcelain. It needs no electrical test to pick out a good glass insulator, which is one advantage of glass over porcelain.
 |
| Fig. 11. High-Voltage Power Transmission. |
To sum up, glass insulators are cheaper, lighter, more easily tested and less likely to be shot at than porcelain; on the other hand, they have less mechanical strength.
In every case, in my experience, where a breakdown has occurred, it has been on a cross-arm which was "wind skaken" and "weather cracked," the current following the cracks. This leads to a curious result. The mark of the current will be on surface of the arm for five or six inches, then disappear from the surface altogether for some inches, then reappear, etc. On cutting open the arm one sees how the current has followed the best path, dodging in and out. Rain and moisture probably settle toward the cracks, carrying salts from the body and surface of the wood. This forms a path of low resistance, especially in wet weather. For this reason I have in the plant of the Colorado Electric Power company taken particular pains in treating both pins and cross-arms. The cross-arm treatment is such as fills all cracks and fissures, as a section of the wood shows.
This report would be incomplete without an acknowledgment of the assistance rendered in the work by the engineering force of the Telluride Power Transmission company, headed by Mr. P. N. Nunn. Especial credit should be given Mr, A. L. Woodhouse for his faithful work and constant perseverance in the face of great discouragement.
